Data visualization
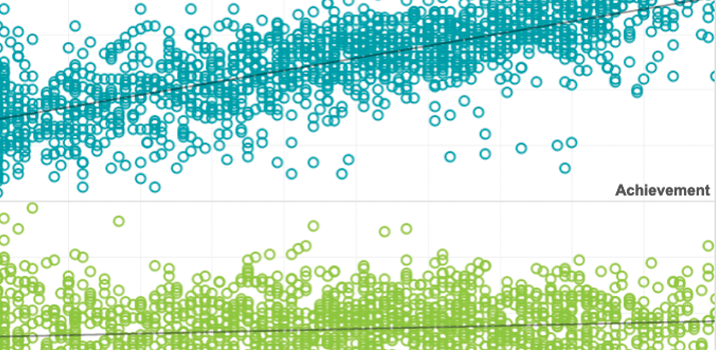
Achievement and growth tables for private schools
2020

Description
This interactive tool provides context on the typical patterns of achievement and growth in mathematics and reading for private and Catholic schools who take MAP Growth assessments. It provides multiple ways to examine patterns for different groups of students, including by student gender, race/ethnic group, region, and state.
See MoreRelated Topics

Moving from data to making a difference
The problems faced within education resemble the problems in many social settings in that they lack clear definitions, have many potential causes, lack simple solutions, and defy straightforward measurement. In this article, Andrew Hegedus shares a view on the types of problems faced in education and outlines key characteristics of a process that begins with collecting data and ends with evaluating progress.
Topics: Empowering educators, High school, High-growth schools & practices
Using test scores for teacher evaluation: Why caution is necessary
This article offers insight and guidance on issues to think about before tests are used as an evaluation tool and to help ensure better choices are made about the role test scores play in a teacher’s evaluation.
Topics: Empowering educators, Student growth & accountability policies
Developing more meaningful definitions of college readiness
Complementing traditional quantitative measures with more qualitative tools can help determine college and career readiness.

The utility of adaptive testing in addressing the problem of unmotivated examinees
This integrative review examines the motivational benefits of computerized adaptive tests (CATs), and demonstrates that they can have important advantages over conventional tests in both identifying instances when examinees are exhibiting low effort, and effectively addressing the validity threat posed by unmotivated examinees.
Topics: Measurement & scaling, Innovations in reporting & assessment, School & test engagement
Making teacher goal setting more powerful
Most of us believe that when individuals have goals, their performance improves, and this belief is being put to the test in schools today. In an effort to create alignment between district and school improvement efforts, teachers are more likely than ever to have formal performance goals.
Topics: Empowering educators, High-growth schools & practices
The potential of adaptive assessment
In this article, the authors explain how CAT provides a more precise, accurate picture of the achievement levels of both low-achieving and high-achieving students by adjusting questions as the testing goes along. The immediate, informative test results enable teachers to differentiate instruction to meet individual students’ current academic needs.
Topics: Innovations in reporting & assessment, Measurement & scaling, Student growth & accountability policies
Effort analysis: Individual score validation of achievement test data
Whenever the purpose of measurement is to inform an inference about a student’s achievement level, it is important that we be able to trust that the student’s test score accurately reflects what that student knows and can do. Such trust requires the assumption that a student’s test event is not unduly influenced by construct-irrelevant factors that could distort his score. This article examines one such factor—test-taking motivation—that tends to induce a person-specific, systematic negative bias on test scores.
Topics: Measurement & scaling, Innovations in reporting & assessment, School & test engagement