Data visualization
NWEA’s MAP Growth National Dashboard provides timely trends and data on U.S. student academic achievement and growth for grades K-8. This free public tool supports district leaders, state and federal policymakers, and other education stakeholders in interpreting local data within a broader national and state context. It helps identify areas of strength, shine light on disparities, and ground policy conversations in evidence.
Products: MAP Growth
Topics: COVID-19 & schools, Equity, Growth

Specialty Schools National Dashboard
This interactive tool provides information about academic achievement and growth for several categories of US schools that used MAP Growth assessments. These groups included secular and religious private schools (including Roman Catholic, Jewish, Lutheran, Islamic, Seventh-Day Adventist, and other religiously affiliated institutions) as well as public charter schools. Use this dashboard to examine patterns of growth and achievement across seasons, academic subjects, school types, and student demographics.
Products: MAP Growth
Topics: COVID-19 & schools, Equity, Growth

The MAP Growth Goal Explorer is designed to support and simplify the goal-setting process by showing a range of possible fall-to-spring growth goals against the backdrop of important academic benchmarks.
Products: MAP Growth
Exploring the educational impacts of COVID-19
This visualization was developed to provide state-level insights into how students performed on MAP Growth in the 2020–2021 school year. Assessments are one indicator, among many, of the student impact from COVID-19. Our goal with this tool is to create visible data that informs academic recovery efforts that will be necessary in the 2022 school year and beyond.
Topics: COVID-19 & schools, Innovations in reporting & assessment

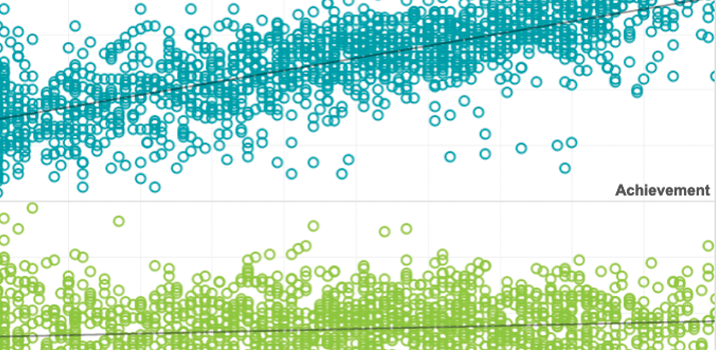
Learning during COVID-19: Initial findings on students’ reading and math achievement and growth
These visualizations allow you to explore key questions from our report, Learning during COVID-19: Initial findings on students’ reading and math achievement and growth.
Topics: Equity, COVID-19 & schools
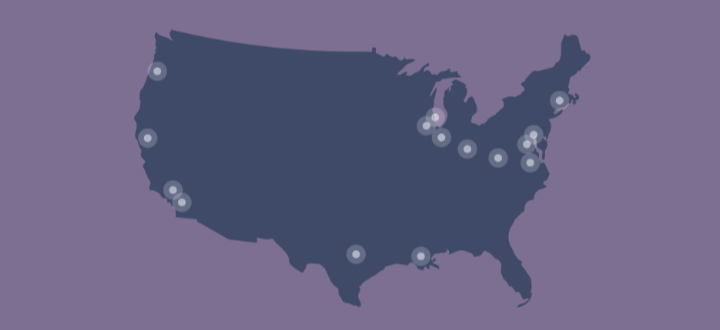
Explore this interactive map to learn more about some NWEA research partnerships.

College Explorer from NWEA® helps students, parents, and teachers develop pathways to higher education. This powerful tool links MAP® Growth™ scores with national benchmarks for colleges, universities, and even specific majors.
Topics: Innovations in reporting & assessment, College & career readiness, High school