Data visualization
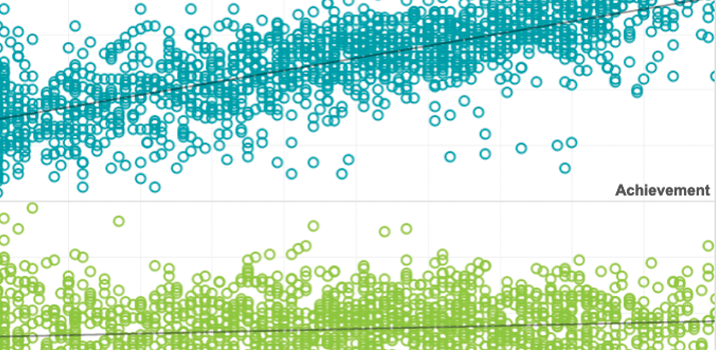
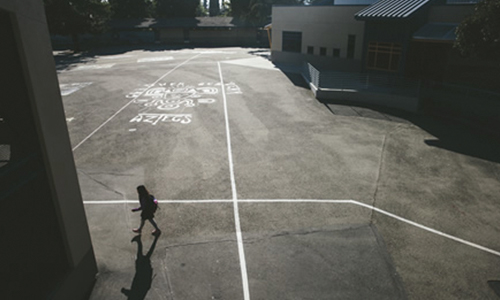
Do high flyers maintain their altitude?
In the visualizations in this exhibit, you can compare the performance and growth of various groups of high achievers to that of their peers over multiple years.
Topics: Equity, High-growth schools & practices
A level playing field: College readiness standards
Some of our assumptions about the growth and performance of students from high-poverty schools relative to their peers from wealthier schools may be challenged in this data gallery, where you can explore how school poverty level interacts with student growth, college readiness, and college access.
Topics: Equity, College & career readiness
Evaluating the relationships between poverty and school performance
This visualization presents findings from our report Evaluating the Relationships Between Poverty and School Performance and gives you the chance to explore how your school site compares to schools from the sample.
Topics: Equity, High-growth schools & practices
College Explorer from NWEA® helps students, parents, and teachers develop pathways to higher education. This powerful tool links MAP® Growth™ scores with national benchmarks for colleges, universities, and even specific majors.
Topics: Innovations in reporting & assessment, College & career readiness, High school

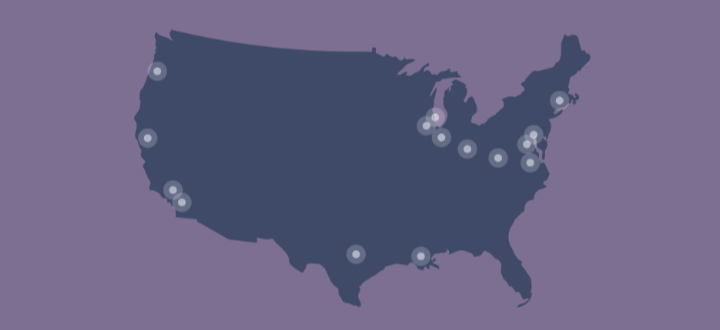
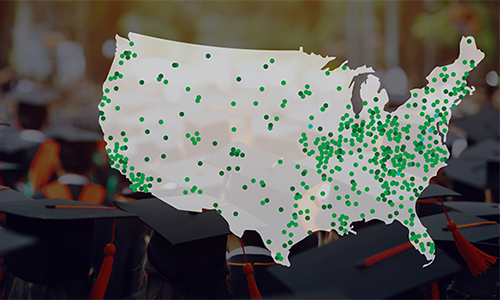
Explore this interactive map to learn more about some NWEA research partnerships.
The MAP Growth Goal Explorer is designed to support and simplify the goal-setting process by showing a range of possible fall-to-spring growth goals against the backdrop of important academic benchmarks.
Topics: COVID-19 & schools, Empowering educators, Innovations in reporting & assessment
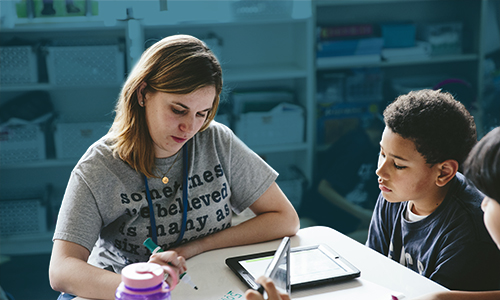
Achievement and growth tables for private schools
This interactive tool provides context on the typical patterns of achievement and growth in mathematics and reading for private and Catholic schools who take MAP Growth assessments. It provides multiple ways to examine patterns for different groups of students, including by student gender, race/ethnic group, region, and state.
Topics: Innovations in reporting & assessment, Empowering educators