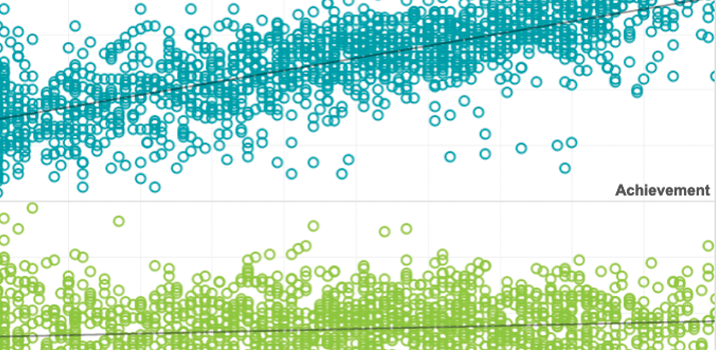
Data visualization
Specialty Schools National Dashboard
2025

Description
This interactive tool provides information about academic achievement and growth for several categories of US schools that used MAP Growth assessments. These groups included secular and religious private schools (including Roman Catholic, Jewish, Lutheran, Islamic, Seventh-Day Adventist, and other religiously affiliated institutions) as well as public charter schools. Use this dashboard to examine patterns of growth and achievement across seasons, academic subjects, school types, and student demographics.
See MoreTopics: COVID-19 & schools, Equity, Growth
Associated Research


Related Topics

This is the technical appendix for the NWEA research brief titled, “Behind at the Starting Line,” which examines Kindergarten test scores from more than 400,000 U.S. students and noting patterns that can predict academic success or identify students at risk of falling further behind. This early identification is key for educators, enabling them to intervene and influence learning trajectories before the next critical milestone: third grade.
Products: MAP Growth
Topics: Informing instruction, Early learning, Empowering educators, Growth

NWEA research brief examining Kindergarten test scores from more than 400,000 U.S. students and noting patterns that can predict academic success or identify students at risk of falling further behind. This early identification is key for educators, enabling them to intervene and influence learning trajectories before the next critical milestone: third grade.
Products: MAP Growth
Topics: Early learning, Empowering educators, Growth, Informing instruction
This is the technical appendix to the research, “Academically diverse classrooms, deeper needs,” research brief examines the academic diversity of post-COVID classrooms, including the composition and spread of academic achievement levels. Key findings highlight the challenges facing educators as more students are off-track and further behind grade-level proficiency.
Products: MAP Growth
Topics: COVID-19 & schools, Empowering educators, Growth, Informing instruction

Academically diverse classrooms, deeper needs: What teachers face after the pandemic
This research brief examines the academic diversity of post-COVID classrooms, including the composition and spread of academic achievement levels. Key findings highlight the challenges facing educators as more students are off-track and further behind grade-level proficiency.
Products: MAP Growth
Topics: COVID-19 & schools, Empowering educators, Growth, Informing instruction

This white paper examines the landscape of middle school science course offerings, enrollment patterns, and assessment outcomes. The analysis of data from 2,200 schools finds that multi-disciplinary course models now dominate versus single-course offerings, though access to course types varies by race and ethnicity. In addition, students in different course models performed similarly on assessments.
Products: MAP Growth
Topics: Equity, Math & STEM

A Practical Guide for Considering and Interpreting Test Score Differences Among Student Subgroups
This guide offers recommendations for how to understand what differences may exist when looking at data for student groups, and gives leaders some structure for how they might consider and interpret those differences.
Products: MAP Growth
Topics: Empowering educators, Equity, Growth, Guidance
Spanish MAP Reading Fluency Technical Report
This technical report outlines the design, scoring, reliability, and validity of the Spanish MAP Reading Fluency assessment, demonstrating how it measures foundational skills and oral reading fluency to support early literacy development.
Products: MAP Reading Fluency
Topics: Early learning, Equity, Measurement & scaling, Test design