Blog article
Mapping the road to college with the College Explorer tool
2016
Description
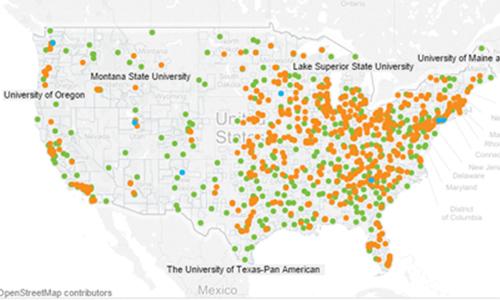
NWEA recently launched a new tool called College Explorer that enables middle school and early high school-age students to use their Measures of Academic Progress ® (MAP®) scores to see which colleges and universities they’re on track to enter long before they embark on the college application process. Below are some FAQs that we thought you would like to know. Go to this link to access all FAQs.
See MoreAssociated Research
Blog article

Data visualization

Media mention
Related Topics

MAP Reading Fluency with Coach Evidence Base
This document provides an overview of the research underlying MAP Reading Fluency with Coach’s AI-powered intelligent reading tutor and the research on key elements of early literacy instruction. It describes the components of the MAP Reading Fluency with Coach pedagogy and the research base supporting each component.
Products: MAP Reading Fluency
Topics: Early learning, Empowering educators, Innovations in reporting & assessment, Reading & language arts
Exploring the educational impacts of COVID-19
This visualization was developed to provide state-level insights into how students performed on MAP Growth in the 2020–2021 school year. Assessments are one indicator, among many, of the student impact from COVID-19. Our goal with this tool is to create visible data that informs academic recovery efforts that will be necessary in the 2022 school year and beyond.
Topics: COVID-19 & schools, Innovations in reporting & assessment

Executive Summary: Content proximity spring 2022 pilot study
This executive summary outlines results from the Content Proximity spring 2022 pilot study, including information on the validity, reliability, and test score comparability of MAP Growth assessments that leverage this new item-selection algorithm.
Products: MAP Growth
Topics: Computer adaptive testing, Innovations in reporting & assessment, Test design
Content Proximity Spring 2022 Pilot Study Research Report
The purpose of this research report is to provide detailed information about updates to the MAP Growth item-selection algorithm. This brief includes results from the Content Proximity pilot study, including information on the validity, reliability, and test score comparability of MAP Growth assessments that leverage this new item-selection algorithm.
Products: MAP Growth
Topics: Computer adaptive testing, Innovations in reporting & assessment, Test design

This study compared the test taking disengagement of students taking a remotely administered an adaptive interim assessment in spring 2020 with their disengagement on the assessment administered in-school during fall 2019.
Topics: Equity, Innovations in reporting & assessment, School & test engagement

This study evaluates the effects of asking items throughout the passage (i.e., embedding items) to achieve a more precise measure of reading comprehension by removing barriers for students to demonstrate their understanding. Results showed a significant impact of embedding comprehension items within reading passages on the measurement of student achievement in comparison to answering items at the end of the passage.
Topics: Equity, Innovations in reporting & assessment, Reading & language arts
Using data from the Applied Problems subtest of the Woodcock-Johnson Tests of Achievement administered to 1,364 children from the National Institute of Child Health and Human Development (NICHD) Study of Early Childcare and Youth Development (SECCYD), this study measures children’s mastery of three numeric competencies (counting, concrete representational arithmetic and abstract arithmetic operations) at 54 months of age.
Topics: College & career readiness, Early learning, Math & STEM