Research brief
Typical learning for whom? Guidelines for selecting benchmarks to calculate months of learning
November 2023

Description
To describe the impact of the COVID-19 pandemic on students, researchers have translated test scores into months of learning to claim how many months/years students are behind in school. Despite its perceived accessibility, there are major downsides to this translation. To inform future uses by researchers and media, we discuss in this brief how to calculate this metric as well as its trade-offs.
See MoreRelated Topics

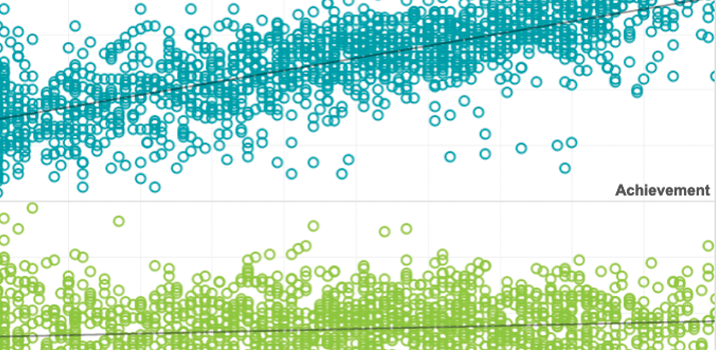
This is the technical appendix to the research, “Academically diverse classrooms, deeper needs,” research brief examines the academic diversity of post-COVID classrooms, including the composition and spread of academic achievement levels. Key findings highlight the challenges facing educators as more students are off-track and further behind grade-level proficiency.
Products: MAP Growth
Topics: COVID-19 & schools, Empowering educators, Growth, Informing instruction

Academically diverse classrooms, deeper needs: What teachers face after the pandemic
This research brief examines the academic diversity of post-COVID classrooms, including the composition and spread of academic achievement levels. Key findings highlight the challenges facing educators as more students are off-track and further behind grade-level proficiency.
Products: MAP Growth
Topics: COVID-19 & schools, Empowering educators, Growth, Informing instruction

This white paper examines the landscape of middle school science course offerings, enrollment patterns, and assessment outcomes. The analysis of data from 2,200 schools finds that multi-disciplinary course models now dominate versus single-course offerings, though access to course types varies by race and ethnicity. In addition, students in different course models performed similarly on assessments.
Products: MAP Growth
Topics: Equity, Math & STEM

A Practical Guide for Considering and Interpreting Test Score Differences Among Student Subgroups
This guide offers recommendations for how to understand what differences may exist when looking at data for student groups, and gives leaders some structure for how they might consider and interpret those differences.
Products: MAP Growth
Topics: Empowering educators, Equity, Growth, Guidance
Spanish MAP Reading Fluency Technical Report
This technical report outlines the design, scoring, reliability, and validity of the Spanish MAP Reading Fluency assessment, demonstrating how it measures foundational skills and oral reading fluency to support early literacy development.
Products: MAP Reading Fluency
Topics: Early learning, Equity, Measurement & scaling, Test design
MAP Growth Spanish Technical Report- Addendum
This technical addendum report is written to help measurement professionals and administrators evaluate the quality of the MAP Growth’s Spanish assessments.
Products: MAP Growth, MAP Spanish
Topics: Equity, Item response theory, Measurement & scaling, Test design

Should kindergartners be redshirted? Costs likely outweigh academic benefits
This research brief examines the data on holding back five-year-olds from starting kindergarten – a practice known as redshirting. Using national data from over three million kindergartners from NWEA’s MAP Growth K-2 assessment, this study explores redshirting trends between fall 2017 and 2025. It also follows a kindergarten cohort (2021-22) through the third grade, examining whether there were academic advantages for redshirted students.
Products: MAP Growth
Topics: Early learning, Growth