Data visualization
MAP Growth National Dashboard
2025

Description
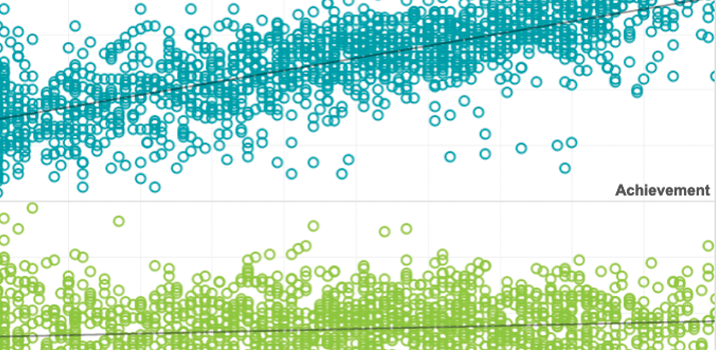
NWEA’s MAP Growth National Dashboard provides timely trends and data on U.S. student academic achievement and growth for grades K-8. This free public tool supports district leaders, state and federal policymakers, and other education stakeholders in interpreting local data within a broader national and state context. It helps identify areas of strength, shine light on disparities, and ground policy conversations in evidence.
See MoreTopics: COVID-19 & schools, Equity, Growth
Associated Research


Related Topics

Technical Appendix for Chronic absenteeism: A continued impediment to academic recovery
This is the technical appendix for “Chronic absenteeism: A continued impediment to academic recovery,” research brief, which examines the relationship between chronic absenteeism and academic recovery from COVID-era disruptions to learning.
Products: MAP Growth
Topics: COVID-19 & schools, Growth

Chronic absenteeism: A continued impediment to academic recovery
This research brief examines the relationship between chronic absenteeism and academic recovery from COVID-era disruptions to learning. Using MAP Growth data from 2,000 US school districts, NWEA researchers analyzed whether persistently high absenteeism rates were associated with slower recovery in math and reading.
Products: MAP Growth
Topics: COVID-19 & schools, Growth

This is the technical appendix for the NWEA research brief titled, “Behind at the Starting Line,” which examines Kindergarten test scores from more than 400,000 U.S. students and noting patterns that can predict academic success or identify students at risk of falling further behind. This early identification is key for educators, enabling them to intervene and influence learning trajectories before the next critical milestone: third grade.
Products: MAP Growth
Topics: Informing instruction, Early learning, Empowering educators, Growth

NWEA research brief examining Kindergarten test scores from more than 400,000 U.S. students and noting patterns that can predict academic success or identify students at risk of falling further behind. This early identification is key for educators, enabling them to intervene and influence learning trajectories before the next critical milestone: third grade.
Products: MAP Growth
Topics: Early learning, Empowering educators, Growth, Informing instruction
This is the technical appendix to the research, “Academically diverse classrooms, deeper needs,” research brief examines the academic diversity of post-COVID classrooms, including the composition and spread of academic achievement levels. Key findings highlight the challenges facing educators as more students are off-track and further behind grade-level proficiency.
Products: MAP Growth
Topics: COVID-19 & schools, Empowering educators, Growth, Informing instruction

Academically diverse classrooms, deeper needs: What teachers face after the pandemic
This research brief examines the academic diversity of post-COVID classrooms, including the composition and spread of academic achievement levels. Key findings highlight the challenges facing educators as more students are off-track and further behind grade-level proficiency.
Products: MAP Growth
Topics: COVID-19 & schools, Empowering educators, Growth, Informing instruction
This white paper examines the landscape of middle school science course offerings, enrollment patterns, and assessment outcomes. The analysis of data from 2,200 schools finds that multi-disciplinary course models now dominate versus single-course offerings, though access to course types varies by race and ethnicity. In addition, students in different course models performed similarly on assessments.
Products: MAP Growth
Topics: Equity, Math & STEM