Data visualization
Exploring the educational impacts of COVID-19
2023
Description
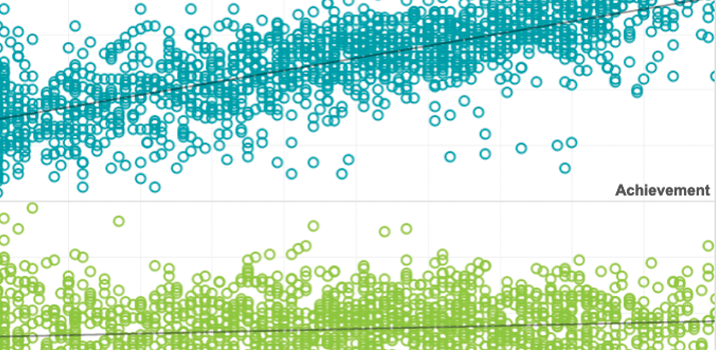
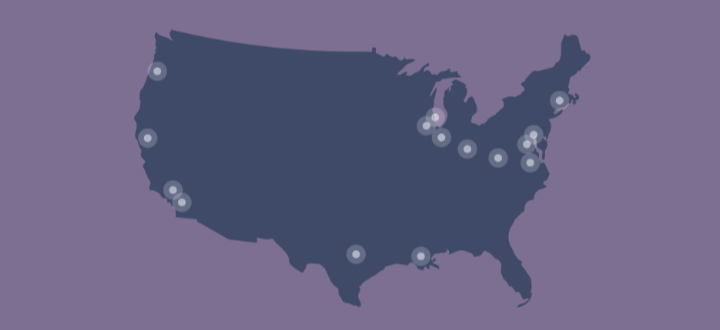
This visualization was developed to provide state-level insights into how students performed on MAP Growth in the 2020–2021 school year. Assessments are one indicator, among many, of the student impact from COVID-19. Our goal with this tool is to create visible data that informs academic recovery efforts that will be necessary in the 2022 school year and beyond.
See MoreAssociated Research
Related Topics
Trend Snapshots: COVID-19 recovery in K–2, positive recovery trends
This short research brief highlights trends seen in the latest data released in the NWEA Map Growth National Dashboard. In this latest edition of Trend Snapshots, key findings focus on trends in K-2 academic recovery following the COVID pandemic.
Products: MAP Growth
Topics: COVID-19 & schools, Growth, Seasonal learning patterns & summer loss
Tech Appendix for “From loss to recovery: Diverging paths and uneven gains across schools”
This is the technical appendix to the research brief titled, “From loss to recovery: Diverging paths and uneven gains across schools,” which examines two components of school recovery post-COVID pandemic to better understand recovery patterns.
Topics: COVID-19 & schools, Growth, High-growth schools & practices, Seasonal learning patterns & summer loss
From loss to recovery: Diverging paths and uneven gains across schools
This research brief examines two components of school recovery post-COVID pandemic to better understand recovery patterns. These include initial declines in average achievement and post-pandemic gains in average achievement across schools. By understanding these different recovery patterns, the brief offers insights to policy makers and leaders where to invest for long-term improvement and targeting support where it is needed most.
Topics: COVID-19 & schools, Growth, High-growth schools & practices, Seasonal learning patterns & summer loss
MAP Growth Goal Explorer User’s Guide and FAQ
This user’s guide for the MAP Growth Goal Explorer describes how to use this interactive tool, the benchmarks it uses to provide context on student growth goals, a framework for goal setting, instructions for how to download information from the tool, and answers to frequently asked questions.
Topics: Innovations in reporting & assessment, Empowering educators

Lessons in resilience: A playbook for recovery from natural disasters
This research brief is a follow-up report to NWEA’s brief examining the impact of extreme weather disruptions to teaching and learning. This report offers practical strategies and recommendations to school districts for preparing for extreme weather events to recover faster and lessen the impact on students and teachers.
Topics: COVID-19 & schools, Growth, Seasonal learning patterns & summer loss

Post-Pandemic School Closure Trends: Schools Serving Black Students Disproportionately Closed
This NWEA white paper explores the impacts of permanent school closures on communities. Findings suggest that despite challenges facing districts and the increased rhetoric around closures, most districts have continued to keep schools open; however, when schools were permanently closed, all communities are not affected equally: high poverty and high percentage Black students are more likely to close.
Topics: COVID-19 & schools, Growth
School’s in for Summer: A Scalable and Effective Post-Pandemic Academic Intervention
New research report looks at the effects of post-pandemic summer school on student achievement and district recovery, how program design and implementation aligned with recommended best practices, and how the scale and impact of summer school compared to other interventions, like tutoring.
Topics: COVID-19 & schools, Growth, Seasonal learning patterns & summer loss