Journal article
The forgotten 20 percent: Achievement and growth in rural schools across the nation
October 2021
AERA Open

Abstract
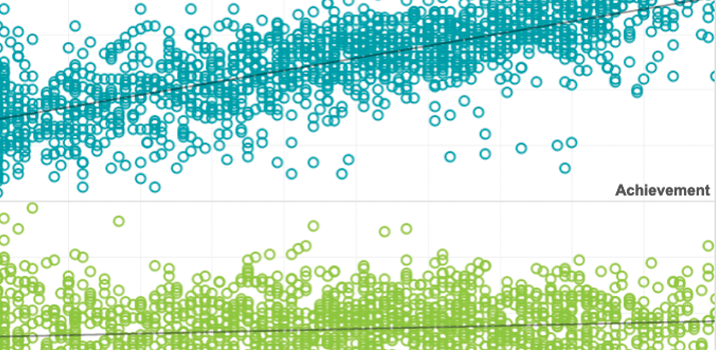
Leveraging achievement data measured in the fall and spring of kindergarten through eighth grade for 840,000 students attending 8,800 public schools, the authors report novel evidence on how achievement and growth patterns differ between rural and nonrural schools. Rural students start kindergarten slightly ahead of nonrural students but fall behind by middle school. The divergence is driven by larger summer losses for rural students. In both rural and nonrural schools, the study provides additional evidence that Black–White achievement gaps widen during the school year. These findings highlight the importance of seasonal learning patterns in interpreting rural school performance.
See MoreThis article was published outside of NWEA. The full text can be found at the link above.
Associated Research

Related Topics

Trend Snapshots: COVID-19 recovery in K–2, positive recovery trends
This short research brief highlights trends seen in the latest data released in the NWEA Map Growth National Dashboard. In this latest edition of Trend Snapshots, key findings focus on trends in K-2 academic recovery following the COVID pandemic.
Products: MAP Growth
Topics: COVID-19 & schools, Growth, Seasonal learning patterns & summer loss

From loss to recovery: Diverging paths and uneven gains across schools
This research brief examines two components of school recovery post-COVID pandemic to better understand recovery patterns. These include initial declines in average achievement and post-pandemic gains in average achievement across schools. By understanding these different recovery patterns, the brief offers insights to policy makers and leaders where to invest for long-term improvement and targeting support where it is needed most.
Topics: COVID-19 & schools, Growth, High-growth schools & practices, Seasonal learning patterns & summer loss

Tech Appendix for “From loss to recovery: Diverging paths and uneven gains across schools”
This is the technical appendix to the research brief titled, “From loss to recovery: Diverging paths and uneven gains across schools,” which examines two components of school recovery post-COVID pandemic to better understand recovery patterns.
Topics: COVID-19 & schools, Growth, High-growth schools & practices, Seasonal learning patterns & summer loss

Lessons in resilience: A playbook for recovery from natural disasters
This research brief is a follow-up report to NWEA’s brief examining the impact of extreme weather disruptions to teaching and learning. This report offers practical strategies and recommendations to school districts for preparing for extreme weather events to recover faster and lessen the impact on students and teachers.
Topics: COVID-19 & schools, Growth, Seasonal learning patterns & summer loss
School’s in for Summer: A Scalable and Effective Post-Pandemic Academic Intervention
New research report looks at the effects of post-pandemic summer school on student achievement and district recovery, how program design and implementation aligned with recommended best practices, and how the scale and impact of summer school compared to other interventions, like tutoring.
Topics: COVID-19 & schools, Growth, Seasonal learning patterns & summer loss

Unequal Access to 8th-Grade Algebra: How School Offerings and Placement Practices Limit Opportunity
This NWEA research brief examines how access to early Algebra – a key gateway to advanced high school math, STEM majors, and higher lifetime earnings – remains highly inequitable across the United States. Using NWEA data from 162,000 eighth-grade students across 22 states, the study looks at both whether schools offer Algebra by 8th grade and how students are placed when it is offered. The findings point to significant gaps tied to school poverty levels, geography, and race/ethnicity.
Topics: College & career readiness, Equity, Math & STEM

This is the technical appendix to the “Unequal Access to 8th-Grade Algebra: How School Offerings and Placement Practices Limit Opportunity” research brief, which examines how access to early Algebra remains highly inequitable across the United States.
Products: MAP Growth
Topics: College & career readiness, Equity, Math & STEM