 Every year, districts set growth goals designed to improve student outcomes. Campus leaders monitor progress, instructional teams analyze data, and educators work to accelerate learning.
While growth is a common topic in conversations about student learning, it may not always be clearly defined. Teams may find themselves asking “What is typical growth?” “What is ambitious but attainable growth?” or “Are we assessing mastery versus assessing growth?”
An if-then mindset helps connect expectations to evidence and evidence to action. It creates a shared framework for interpreting growth data, aligning conversations across campuses, and supporting more consistent decision-making.
Why if-then thinking matters for growth
When educators are analyzing growth data, the data should help answer the following questions:
- Are students progressing as expected?
- Are they on track for proficiency?
An if-then mindset helps districts connect expectations to evidence and evidence to action. It creates a framework that supports continuity in growth conversations, strengthens data analysis, and aligns decision-making across classrooms, campuses, and leadership teams.
The following scenarios illustrate how an if-then approach can help bring clarity to growth conversations and support more informed decision-making for districts that test with MAP® Growth™.
Scenario 1: Unclear growth expectations
If your district sets growth goals but lacks clarity around what typical or ambitious progress looks like, then you need a consistent, research-based way to define and communicate growth.
MAP Growth projections are based on average growth of comparable peers. This creates a level playing field when considering the academic diversity of students served. MAP Growth norms can help you make sense of data and allow you to turn test results into action.
When leadership works with educators to provide clear expectations for data analysis and consistent goal setting with students, we build systems that can be replicated across classrooms and campuses.
Scenario 2: Inconsistent growth conversations
If your district is looking for a clearer way to measure and communicate student growth over time, then a shared framework can create alignment among teams.
I’ve been fortunate enough to facilitate MAP Growth professional learning workshops for districts across the country. There is power in having common questions that guide how educators interpret and use MAP Growth data. In many districts, different campuses may interpret the same data differently. A shared framework ensures growth conversations sound similar regardless of grade level, content area, or campus.
Knowing what questions MAP Growth reports can help answer supports more insightful interpretation of data. It also creates consistency across testing terms and coherence when monitoring student progress and discussing student outcomes.
Knowledge is power. Questions are powerful. Helping educators and students know the questions their MAP Growth data can help answer provides a common reference point for growth discussions and supports alignment district-wide.
Scenario 3: Monitoring accountability and progress
If campuses are working toward accountability goals and need reliable growth data to monitor progress, then they need data that can identify trends, flag areas of need, and allow them to adjust in real time.
MAP Growth provides growth measures that can highlight whether students are progressing as expected. A fan favorite to quickly analyze who has met growth projections is the Achievement Status and Growth (ASG) Summary with Quadrant Chart. This teacher-friendly graphic allows educators to quickly identify students who met growth projections, celebrate areas of success, and determine where additional support may be needed.
An exciting update for fall 2026 is the standards tab within the Class Profile report.
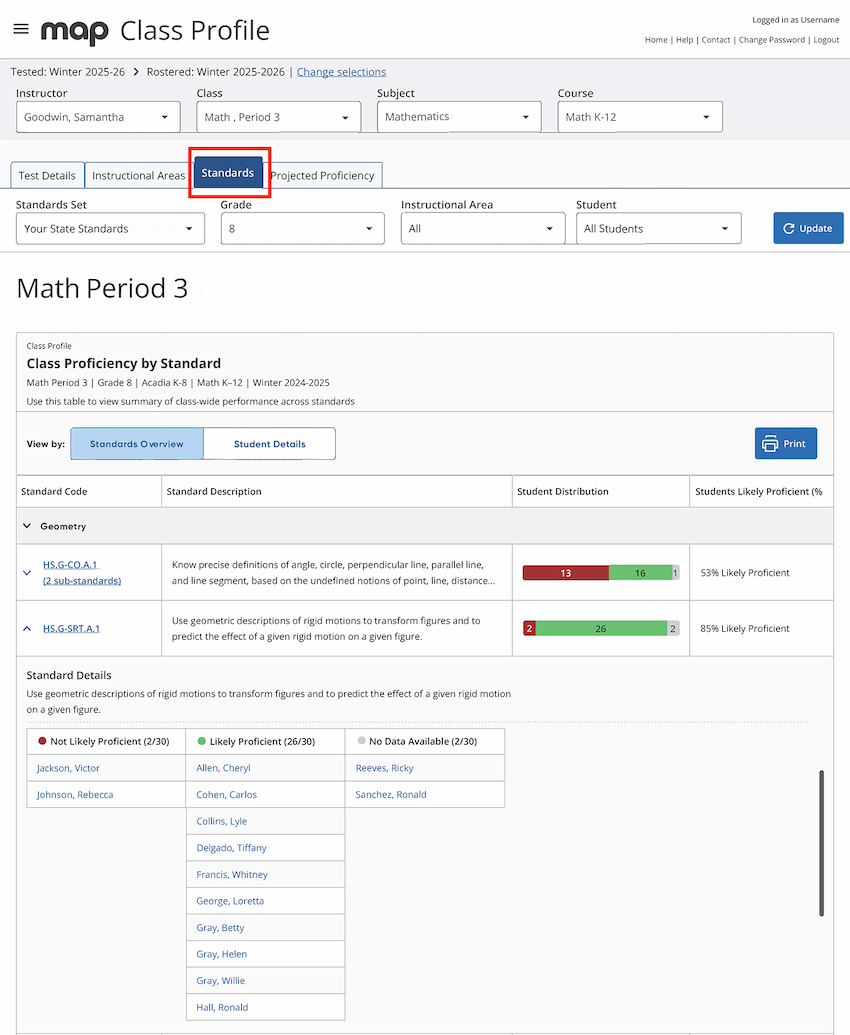 The standards tab is designed to help teachers see how students are performing against specific standards, so they can move more quickly from data to instructional decisions without extra steps. This can guide ongoing progress monitoring.
Scenario 4: On track to proficiency (or not?)
If instructional leaders want deeper insight into whether students are on track to proficiency or long-term growth goals, then they need forward-looking data, not just a snapshot.
MAP Growth provides projections that offer insight into future performance trajectories on tests including state summative assessments, the SAT, and the ACT. These insights can assist in instructional adjustments, intervention prioritization, and long-term planning.
Classroom teachers can utilize the state assessment linking study in particular as another way to create flexible student groups and identify students that may benefit from stretch goals, while campus and district leadership can use the data to evaluate systems and resource allocations. Looking forward rather than backward allows leaders to move from reacting to results to proactively planning supports before gaps widen.
From measuring to meaning
Growth data is most powerful when it provides context for decision-making. Data alone does not improve outcomes; the conversations and actions that follow do. The value of growth data is not found in the reports but in how educators use it to inform next steps.
When we shift our thinking from “Did students grow?” to “Are students growing as expected—and what should we do next?” we ultimately move from a simple yes or no to analysis and action planning. When educators understand not only whether students grew but also whether they grew as expected and what actions should come next, growth becomes a catalyst for continuous improvement.
Three questions to ask about your growth measures
As you think about growth analysis and structures in your district, ask yourself the following questions:
- Do we have a clear, shared understanding of what typical and ambitious growth looks like?
- Are our growth conversations consistent across campuses and teams?
- Can we use our data to determine whether students are on track—and adjust instruction accordingly?
Keep growth meaningful
The most meaningful growth conversations occur when everyone—from district leadership to classroom teachers—shares a common understanding of what growth means, how it is measured, and how it informs next steps. As you reflect on your district’s approach to growth, which if-then scenario most closely reflects your current reality?
Growth is more than a metric. It is a tool that helps leaders understand progress, identify opportunities, and make informed decisions on behalf of students. Because the goal isn’t simply to measure growth. It’s to understand it, communicate it clearly, and use it to create meaningful opportunities for every learner.