 As educators, we rarely find ourselves with a shortage of data. What we’ve often struggled with is translating that data into clear instructional decisions. After a testing window, we might spend time reviewing reports, discussing trends, and identifying areas of concern. But many of us probably have the same lingering question: What happens now?
The new state standards view in the MAP® Growth™ Class Profile report creates an opportunity to move beyond asking, What does the data say? and toward what may be the more important question: What should I do next?
The challenge: We’ve always had the data, but the pathway hasn’t always been clear
Over the years, I’ve worked with teachers, instructional coaches, and school leaders who all shared a similar frustration. The challenge wasn’t access to MAP Growth data; it was figuring out how to use it.
Questions I often hear include:
- Which report should I start with?
- How do I connect assessment results to upcoming instruction?
- Which students should I group together?
- What can I do with this evidence tomorrow?
When we’re juggling multiple responsibilities, facing limited planning time, and working with a classroom full of diverse learners, it’s easy for data analysis to feel disconnected from instructional planning. That’s why I think standards-level information is such an exciting step forward and why we’ve made it available with the state standards view in the MAP Growth Class Profile report.
Why standards-level information changes the conversation
At the end of the day, teacher don’t teach reports; we teach standards. We plan lessons and units so students have countless opportunities to engage with grade-level content. That’s why the standards-level reporting feels different. Instead of starting with a RIT score of 210 and trying to reverse engineer what that might mean for a student, we can start with the standard we’re already preparing to teach. We can ask questions like:
- Which students may need additional support with this standard?
- Which students may be ready for extension?
- Where might I need to provide scaffolding?
- What evidence do I want or need to gather before making a grouping decision?
The conversation shifts from understanding data to planning instruction—and that is where we all want to spend our time.
A process for moving from data to instruction
One of the things I appreciate most about the new state standards view in the MAP Growth Class Profile report is that it encourages a simple, repeatable process. Once you’re in the Class Profile report, you can navigate to the standards tab and follow the process outlined below.
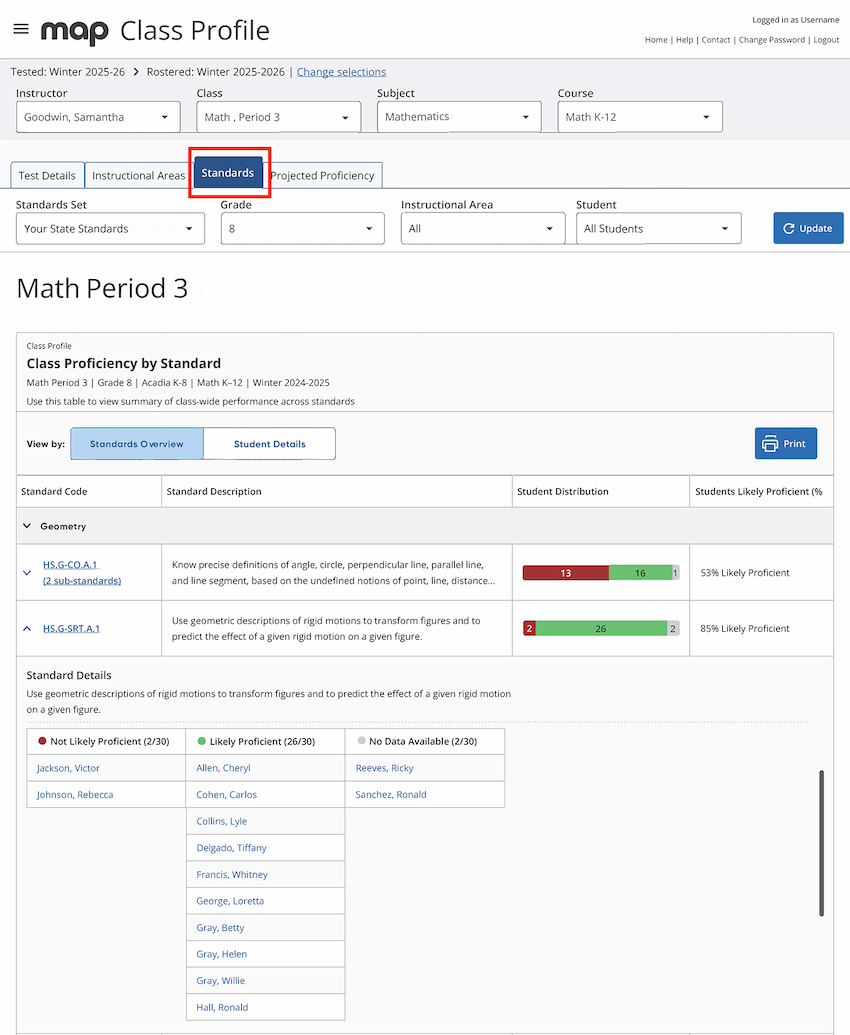
- Start with a focus standard. Begin with the learning goal already in front of you. Maybe you’re preparing for an upcoming geometry unit. Maybe you’re planning a reading analysis. Maybe your PLC has identified some priority standards. Start there!
- Identify students you want to better understand. Use the “Standards” tab to identify students who may need additional support or who may benefit from deeper investigation. Think of this step less as grouping and more as identifying students you want to understand better.
- Explore readiness and instructional entry points. Use supporting information, available in places like the MAP Growth Class Profile report “Instructional areas” tab and the MAP Growth Learning Continuum, to better understand readiness patterns. Students who appear similar at first glance may not always need the same instructional support.
- Determine instructional next steps. This is where the process becomes actionable. What scaffolds might help your students? What formative checks could you use? What small-group opportunities make sense?
- Monitor progress and adjust. As students engage in instruction, continue gathering classroom evidence through observation, discussion, written responses, and formative assessment. Use that evidence to confirm, refine, and adjust your instructional decisions.
Example: What this might look like in a fifth-grade classroom
Let’s imagine I’m preparing for an upcoming informational text unit with my fifth graders. Since students will be engaging with the Key Ideas and Details standard in our upcoming unit, I can use the Learning Continuum to better understand the progression of skills related to that standard and where students may be entering that learning journey.
One thing I’ve noticed over the years is that many students enter fifth grade able to answer questions about a text. They can often find details when the information is right there in front of them. But fifth-grade expectations require students to do more. Students are expected to determine multiple main ideas, explain how details support those ideas, and use evidence from the text to explain their thinking.
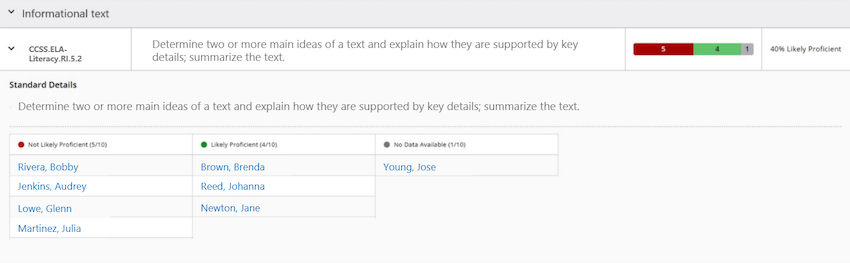
When I look at the standards information in the MAP Growth Class Profile report, I notice Glenn, Julia, Bobby, and Audrey are all students I want to understand better.
 At first glance, they appear similar, but when I look at the “Instructional areas” tab, I notice something interesting: Glenn falls within a different RIT range than the others. Now I’m left wondering, Do these students need the same support?
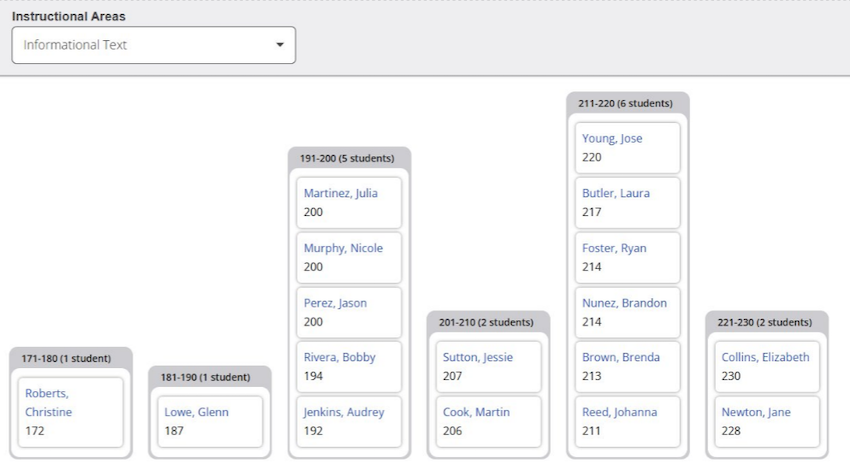 Because I already know students will be engaging with the Key Ideas and Details standard during our upcoming unit, my goal isn’t to determine what to teach next. Instead, I’m looking for evidence that can help me anticipate where students may need different entry points as they work toward the same grade-level expectation. Resources like the Learning Continuum can provide additional context about the broader progression of learning connected to the standard, helping me make more informed decisions about scaffolding and instructional supports. Looking at that progression of learning helps me better understand where students may be entering the work and what background skills or understandings may influence their success. I may consider providing Glenn with additional support connecting key details to a main idea, while Julia, Bobby, and Audrey may be ready for more complex work involving evaluating evidence and supporting claims.
This is just one example of how helping an entire class of students meet the same standard can—and almost always will—require different entry points.
The goal isn’t another report
The new state standards view isn’t a separate report. It’s built into the MAP Growth Class Profile report you already use, making your students’ data easier to act on. And it’s part of Pulse, the learning science layer that makes your MAP Growth data more actionable.
When used together, standards-level information, readiness data, and classroom evidence can move us from a general concern to a focused instructional response. Because at the end of the day, the most valuable data isn’t the data we analyze—it’s the data that helps us take effective action on behalf of students.