

The research team at NWEA serves our educational partners by offering technical support on a range of assessment issues, including how to understand and use MAP® Growth™ norms.
One common question we receive is, “What percentage of students usually make a year’s worth of growth on MAP Growth?” This question is difficult to answer because it’s precisely like asking what percentage of students got taller by one year’s worth. Both questions assume the same false premise: that academic achievement and height are measured in units of time.
This matter can be inadvertently complicated by those who are primarily familiar with assessments that measure whether students meet grade-level “mastery” or “proficiency” with academic content as articulated in a set of standards. Experience with such assessments has led some to rely on metrics that summarize student performance as above or below grade level.
More recently, however, policies have been implemented to recognize the fact that student mastery is only part of the puzzle. Growth is just as important, and for the purposes of measuring school effectiveness, it is even more important, since growth over time is more highly correlated to school factors, whereas mastery measures are more strongly correlated to socioeconomic status and family factors. Consequently, we’re now seeing policies emphasizing the measurement of student academic growth. This has led to the use of the term “years of growth,” as if a predetermined amount of change should occur between years.
Assessing mastery vs. assessing growth
Estimating growth over time is not the same thing as estimating grade-level “mastery.” Tests designed to estimate grade-level “mastery” assess the extent to which students are learning what has been established for them to learn. Tests designed to measure growth aren’t necessarily focused on grade-level mastery but, instead, on whether improvement has occurred between test events. These are different kinds of assessments, and they utilize different metrics.
Whether measuring height or student achievement, one defines growth as the change in an attribute between two time points. If my daughter was 54 inches on her eighth birthday and 56 inches on her ninth birthday, then she grew two inches during that year. So, for her, one year’s worth of growth was two inches. If she produced a MAP Growth math score of 180 on her eighth birthday and a 195 on her ninth birthday, she made 15 RIT points of growth. For her, one year’s worth of growth was 15 RIT points because that’s how much she grew during the year.
Kids don’t grow at the same pace
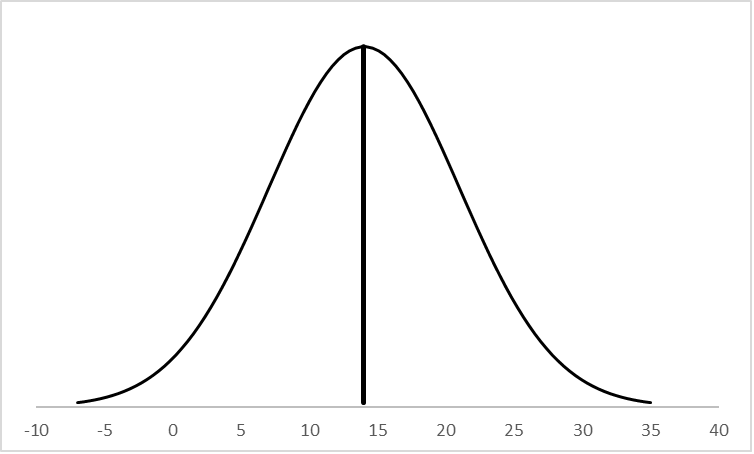
NWEA provides growth norms that allow educators to compare a student’s observed growth relative to a nationally representative comparison group. The norms provide a context for knowing how much growth is typical or atypical for students over a school year or between varying time intervals within a school year. For example, the fall-to-spring growth exhibited by first-graders with a fall math RIT score of 130 is described by a normal distribution (a bell curve) with a mean of 19 points and a standard deviation of seven. It looks like this:

About half of first-graders with this fall score of 130 will show fall-to-spring growth less than about 19 RIT points, and about half will show more than 19 RIT points.
Some schools tabulate the percentage of their students whose growth meets or exceeds their individual growth projections (50% of students typically do so) and report this value as a performance indicator.
Here’s the important thing: while 19 points of growth might be typical for the first-grader who has a fall RIT score of 130, it’s not typical for all first-graders. First-graders with fall math scores of 180 have a fall-to-spring growth distribution that has a mean of 14 and a standard deviation of seven, looking like this:
For these first-graders, “typical” growth is only 14 points.
A “year’s worth of growth” (as defined by mean normative values) varies across kids of differing initial achievement and across kids of different ages. Growth in achievement, just like growth in height, is not constant across all kids. Furthermore, students who meet typical growth are not necessarily on track to meet any external performance criteria, such as state proficiency or college readiness. These students are merely showing change that is at or above average, compared to other students like themselves.
A tip for reporting data
If you work with data from growth measures such as MAP Growth, the next time you are asked what percentage of students shows a year’s worth of growth, give the correct answer: 100%. But if you are asked what percentage of students show change that is “typical” or is consistent with statistical, normative expectations, don’t forget to take into account where students start and how much instructional time is in the test interval of interest.