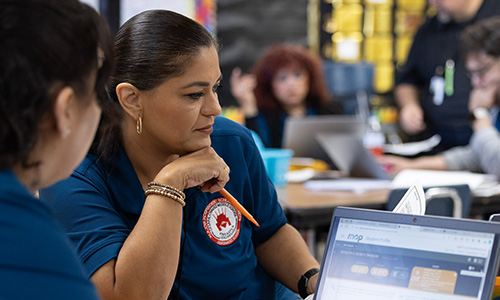
 NWEA president Chris Minnich is known for saying, “An assessment alone has never changed a kid’s life. It’s what comes next that matters.” That statement was the heartbeat of our webinar “3 powerful ways to connect assessment data to instruction.” It featured four educators—me, Mary Resanovich, Jenna Talos, and Yolanda Wallace—who came together to walk through what using data to inform instruction looks like.
Whether you’re a classroom teacher, instructional coach, or district leader, this 60-minute session explores how assessment data can transform instruction—not just in theory, but in real, practical ways. This article will walk you through the major insights from the webinar, with just enough detail to bring clarity and just enough encouragement to make you want to dive into the full presentation.
Getting real about data
Right from the start, the other presenters and I framed the session around three essential questions that educators often ask:
- How can I group my students effectively?
- How is my district doing overall?
- Where is there opportunity for meaningful growth?
The webinar also opened with an important acknowledgement: data is essential but using it effectively in the classroom can be overwhelming. Although many teachers use data to understand student performance, educators face challenges:
- Data arrives late.
- Data piles up fast.
- The next steps aren’t always clear.
That’s where the power of relevant reports, strategic support, and instructionally aligned resources come in. And that’s exactly what the rest of the webinar unpacked.
With Mary: Assessment grain size and classroom-compatible resources
Mary Resanovich, principal content designer at NWEA, gave us the language to think clearly about different types of assessment. She described broader assessments like MAP® Growth™ as thermometers: great for spotting that something’s off but not great for diagnosing why. For that, we need more targeted tools—our X-rays and swabs—like diagnostic or skills-based assessments.
She also reminded us that the purpose of assessment shifts throughout the year; sometimes we’re looking for signs of growth, while other times we’re diagnosing specific needs. Matching the grain size of your assessment to your instructional question is key.
Just as important? What teachers are already doing in their classrooms! Mary walked us through how MAP Growth connects with over 30 digital content providers, giving teachers personalized paths that actually work with what they’re already using. Whether you’re looking for scaffolding, enrichment, or adaptive practice, these tools save time and make it easier to reach every learner.
Watch Mary around minutes 4 and 30 for ideas on how to rethink how you match your assessments to your instructional goals.
With Jenna: Strategic instruction starts with the right questions
Jenna Talos, implementation manager, focused on what many teachers wrestle with: turning raw data into instructional decisions. She structured her segment around three core questions teachers face across the school year:
- Fall: How can I group my students with similar results?
- Winter: What is the next step for small group instruction?
- Spring: Did students perform above or below expectations?
These aren’t just questions for reflection; they’re also lampposts for instructional action. Jenna walks through key MAP Growth reports, like the Class Profile and District Profile reports, showing how each one helps answer a different instructional need, like “How can I group my students effectively?”
One highlight was her walk-through of the Learning Continuum, a dynamic tool that connects student RIT scores to specific skills. Educators, sometimes we need to see the spiraling of skills to pinpoint where a student might need attention. Jenna overviews this game-changer when it comes to planning your next unit or understanding which standards to revisit.
Whether you’re a classroom teacher or a district leader, Jenna’s portion of the webinar will help you see how MAP Growth reports can sharpen your lens and make using data to inform instruction easier. Watch her around minute 7 to see data come alive in planning, grouping, and growing.
With Yolanda: Supporting our earliest readers with MAP Reading Fluency
If you work with pre-K–3 learners, Yolanda Wallace’s segment will feel like a breath of fresh air. She makes it easy to use assessment data to drive instruction, quickly and meaningfully.
She dove into MAP® Reading Fluency™, which not only assesses early reading skills but also guides instructional next steps with clarity and care. The Benchmark Matrix report shows performance at a glance, and reports are color-coded and sortable, making it easy to spot patterns and plan groups. She emphasized that foundational skills, like vocabulary in first grade, are powerful predictors of future comprehension. She showed how to use reports to:
- Group students by ZPD levels
- Track growth opportunities
- Access embedded resources like printables, audio supports, and teacher guides (hello, parent-teacher conferences!)
One of the most powerful elements? Coach Maya, a responsive AI digital differentiator ensuring that when busy teachers are needed elsewhere, students are still supported whether they need reteaching, practice, or a push forward.
Watch Yolanda around minute 20 for a masterclass in how using data to inform instruction supports our youngest readers.
With me, Kailey: Data is meant to change
I hosted and guided the webinar and closed it with a heartfelt reminder: Data isn’t the end. It’s the beginning. We don’t stop when we read the thermometer and realize there’s a fever. We take action with the idea of changing it!
If you’ve ever felt unsure about using data to inform instruction, this webinar gives you a clear lens, a confident path forward, and some questions worth posting above your desk:
- How can this data guide a change I can make tomorrow?
- How can I use it with students to celebrate growth?
- How can I use data to bolster core instruction with supplemental tools?
Don’t just read—watch
There’s so much more in the webinar than any article could capture, including real examples, visuals, embedded tools, and personal stories from the field. Whether you’re a teacher, instructional coach, or district leader, you’ll walk away with something you can use tomorrow.
Because when data is paired with the right tools, time, and intention? It’s not just the numbers. It’s the next step.