
 I have worked for NWEA for nearly 14 years. Over the course of my career here, I have spoken with many administrators and teachers about MAP® Growth™. We’ve discussed how the test is built, what types of items it contains, what the RIT score means, and how the test adapts. The questions I get most frequently, however, particularly from new users, are related to what to do with the data. What can MAP Growth tell me? What does a RIT of 210 in math mean? How do I use this information in my classroom? When these questions arose again at this year’s Fusion conference, I thought it would be worthwhile to talk about the types of questions MAP Growth data can answer at the district, school, class, and student levels.
A quick MAP Growth refresher
To make sure everyone is on the same page, I want to start by explaining what MAP Growth is. It is an adaptive interim assessment that can be administered up to four times a year (fall, winter, spring, and summer). It measures student achievement and growth over time using an equal-interval scale (think of a ruler) called the RIT scale. The test is norm-referenced, meaning growth and achievement norms contextualize a student’s score relative to their peers. It is also criterion-referenced, because NWEA has produced linking studies that predict students’ performance on summative and college- and career-ready assessments based on their MAP Growth score.
MAP Growth tests have 40–43 questions. Unlike other tests, students are expected to get only about 50% of the items correct because the test is designed to find the sweet spot of each student’s zone of proximal development. Essentially, the test is trying to identify the edge of a student’s understanding, or the space between what they can do now and what they can’t do yet. The test prioritizes on-grade content but adapts off-grade when needed, to reach all ends of the achievement spectrum. Each test produces an overall RIT score and typically up to five instructional area RIT scores, depending upon the structure of the state’s standards. RIT is a measure of both item difficulty and student achievement.
District and school-level questions
Now that we’ve covered the basics of MAP Growth, let’s look at the types of questions the assessment can answer at various levels.
The first thing to keep in mind is that MAP Growth is excellent at giving you a starting point for further investigation. It can help uncover trends you can dig deeper into to support student achievement and growth. My colleague Chris Orcutt explains it well in his article “Universal screening 101.” When used as a universal screener, taking MAP Growth is like being screened for a fever by a doctor. The test can tell you if there’s an issue, which you can then probe with more fine-tuned instruments to get more granular data.
MAP Growth data can help administrators examine trends and identify high-level needs at both district and school levels. Reports like the District Profile and School Profile can provide a sense of trends across schools and grades.
Let’s imagine you are a district administrator opening the District Profile report. The “Achievement Overview” on the “Single-Term Achievement” tab gives you a 10,000-foot view of achievement across your district.
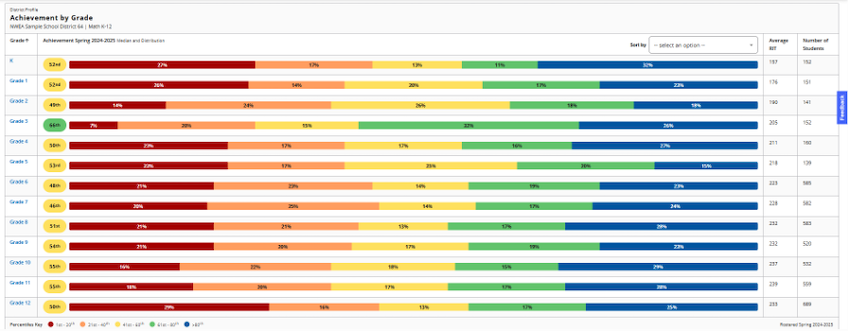 Looking at the “Achievement by Grade” section of the report can help illuminate trends at this level. Seeing the higher achievement in grade 3 might prompt an administrator to ask the following questions:
- If I look at last year’s data on the District Profile, do I see a similar level of achievement in grade 2, indicating this achievement might be related to the cohort of students? Or do I see a similar level of achievement in grade 3, indicating this achievement might be related to something being done in the third-grade classrooms in my district?
- If I look at the School Profile, is the higher achievement in grade 3 consistent across the district, or are only some schools achieving at a high level in this grade? If the latter, what are those schools doing differently that we might want to replicate elsewhere?
The District and School Profile reports can also help administrators gauge the impact of program or product implementations. Let’s say my district implemented a new early literacy program last year. Comparing this year’s scores in grades 1–3 to previous years’ scores can give insight into the efficacy and impact of the new program.
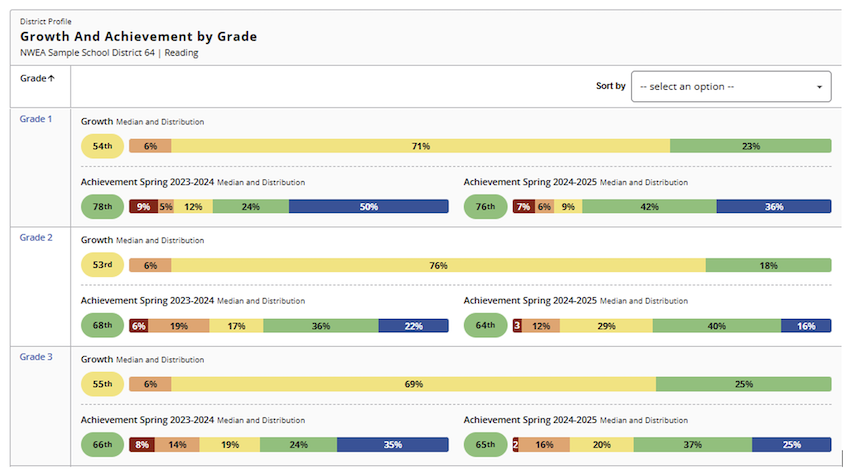 If, as in the case above, achievement is either stagnant or has dropped, it might prompt you to ask questions about the implementation of the program. NWEA Vice President of Research and Policy Partnerships Karyn Lewis provides a great framework for thinking about data:
- Use data to illuminate, not intimidate. Use data to uncover areas for investigation. Even when a trend is negative, think of it as an opportunity for discovery, not punishment.
- Look upstream. Look at the ecosystem to see what might be impacting the results in question, whether they are positive or negative.
- Act. Once you have exposed root causes underlying the data, determine next steps to support continuous improvement.
In the example above, the administrator might pose questions like:
- Is more professional development needed for teachers?
- Was the program implemented with fidelity?
- Could altering schedules and systems within the schools better support this initiative?
- Is the program having the same impact, or lack of impact, on all student groups?
Once data is gathered to answer these questions, an action plan can be developed and implemented.
Here are some other questions the District and School Profile reports can answer.
- Overall, are there any trends in terms of subject areas?
- What are the bright spots in the district? What programs, policies, or curriculum are in place where students are seeing more growth?
- Which schools and grades will require more resources to support student growth and achievement?
- Are the trends consistent across student groups?
Class-level questions
I get the “What do I do with this data?” question most often from teachers. MAP Growth is designed to efficiently measure growth and achievement, and it does this with around 40 questions, which is not enough to report out on mastery at a standards level. Thus, many teachers feel it has no relevance to the classroom. And while it is true that MAP Growth data cannot help you know what to teach tomorrow—your state standards and curriculum scope and sequence should do that—it can help you gauge how the academic diversity of your class may impact how you teach that content.
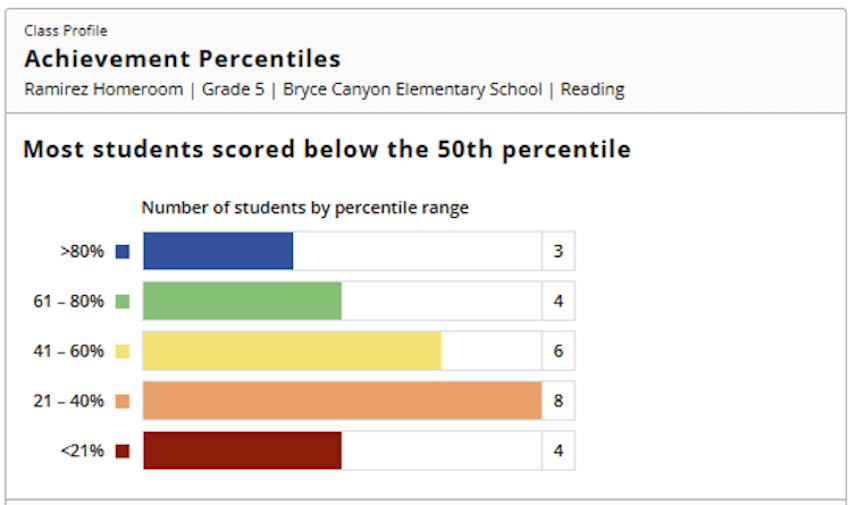
At the start of the year in particular, the “Achievement Percentiles” section of the Class Profile can help teachers quickly understand how academically diverse their class is. A graph like the one below indicates to a teacher that there is significant academic diversity in reading achievement, thus they will need to employ many scaffolds and supports to help students access on-grade text.
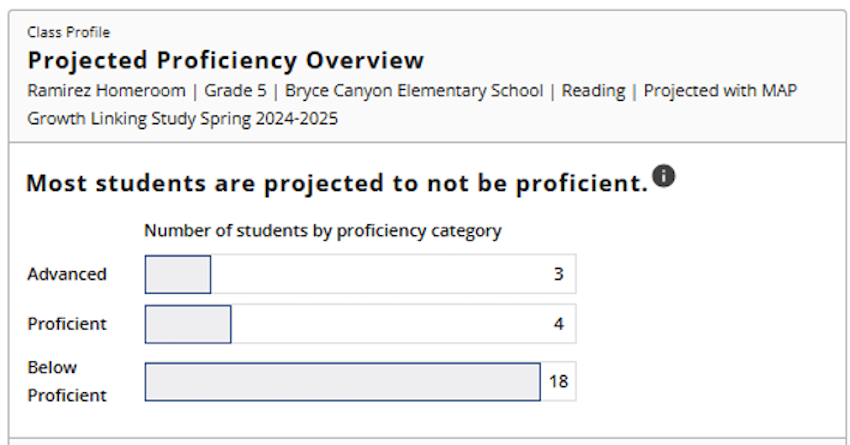
 Furthermore, the “Projected Proficiency” tab indicates that over 70% of the class is not currently on track to meet state proficiency expectations. This means that most of the class will need to make greater than typical growth to start closing that gap.
 Understanding relative areas of strength and opportunity within your class can help you leverage those strengths when planning for instruction. MAP Growth data is best at informing instruction at the unit level.
Let’s imagine you are a fourth-grade teacher looking at class math scores from the latest MAP Growth assessment in preparation for an upcoming unit on writing and solving multistep equations.
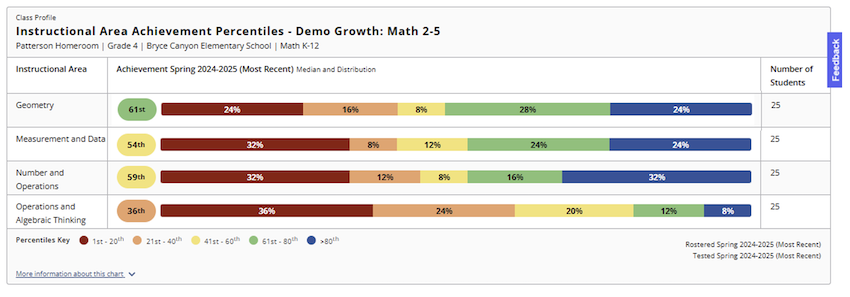 Looking at the “Instructional Areas” tab of the Class Profile report, you see that, for the class as a whole, the “Operations and Algebraic Thinking” instructional area is the area of greatest opportunity, with 80% of the class performing in the bottom three quintiles, or below the 60th percentile. You also see that the “Geometry” instructional area is the area of greatest strength, with nearly 55% of students above the 60th percentile. To leverage the class’s relative strength in spatial reasoning skills, as indicated by higher instructional area RIT scores in geometry, you supplement the models in your curriculum with tape diagrams and other visual models to help students understand and represent word problems. Given the low performance of the class in “Operations and Algebraic Thinking,” you may also decide to use formative assessment to learn more about the students’ ability relative to representing and solving word problems. Additionally, you may look for research-based approaches to teaching word problems, such as a schema-based approach detailed at the IRIS Center.
Student-level questions
When considering individual students, the Student Profile can answer a wealth of questions:
- Is this student projected to be on track for end-of-year and/or college-and-career proficiency?
- Is this student making above or below typical (50th percentile) growth?
- Which subjects and instructional areas are this student’s strengths?
- How engaged was the student during the test?
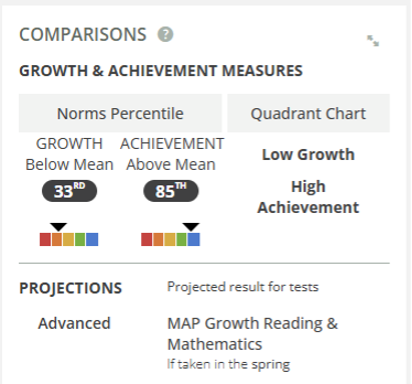
The “Comparisons” section of the Student Profile can give a quick snapshot of a student’s performance relative to both norms and to end-of-year expectations. For the student below, I can see that although she exhibits 85th percentile achievement and is likely to perform in the advanced category for her state summative test, her growth is well below typical. This may indicate that not enough is being done to challenge this student. As a teacher, I need to look for opportunities to stretch and deepen her learning.
 The “Growth Over Time” graph can also provide rich information about the student’s growth and achievement trajectory. Looking at the graph for the student below, I immediately notice some interesting trends. The student consistently shows a high level of growth between spring and fall and a drop in growth and achievement during the school year.
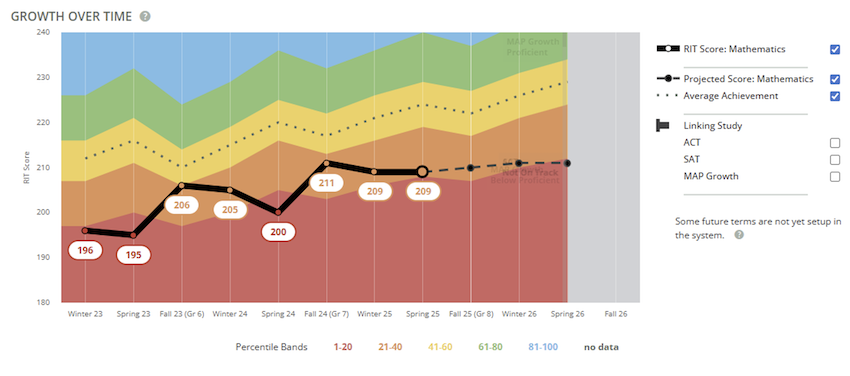 This reversal of typical trends makes me curious. What happened during the summer to account for this rapid increase? Did the student attend a summer school program or get tutoring? Did they have the opportunity to pursue a topic of deep personal interest? By talking to the student, their guardians, and previous teachers, I may be able to uncover the why behind their growth and determine how to foster such growth across the school year. This example may be unique, but looking for reasons to explain any significant change in the rate of a student’s growth can help you uncover what works best for that student so you can accelerate their growth.
MAP Growth data can also answer questions about which students might need significant intervention or enrichment. In both cases, MAP Growth should not be the only data point, but as a universal screener, it can be used to identify students to review for potential inclusion in intervention or gifted programs.
Answering questions for families and caregivers
Because of the unique nature of MAP Growth, it may be challenging to explain the purpose and results of the test. With most tests, a parent or caregiver’s first question is likely, “How many questions did they get right?” And for most tests, 50% is not a desirable answer! Using the Family report and the Student Profile report to focus on the questions below can help families and caregivers understand their student’s MAP Growth data:
- How did the student perform compared to peers? You can relate NWEA achievement norms to height and weight charts used by doctors to assess children’s literal growth. The Family report explains how the norms compare a student to students in the same grade, with the same starting RIT, and the same number of weeks of instruction.
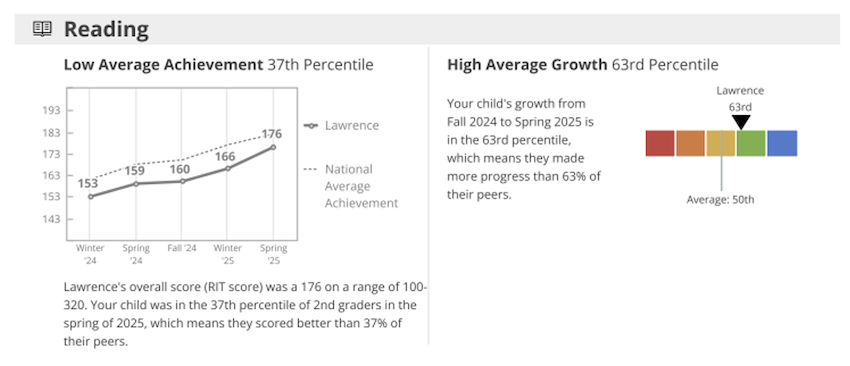
- How is the student growing? Education tends to focus primarily on achievement. Parents and caregivers typically want to know about the student’s proficiency relative to end-of-year tests. While this is an important question to address, MAP Growth data highlights the need to look at both growth and achievement. For low-performing students, talking about growth can highlight student success. In the example from the Family report below, you can discuss that while the student is below the 50th percentile for achievement, they are making more than typical growth. If the student can sustain this level of growth, their achievement will also rise, moving them closer to predicted proficiency.
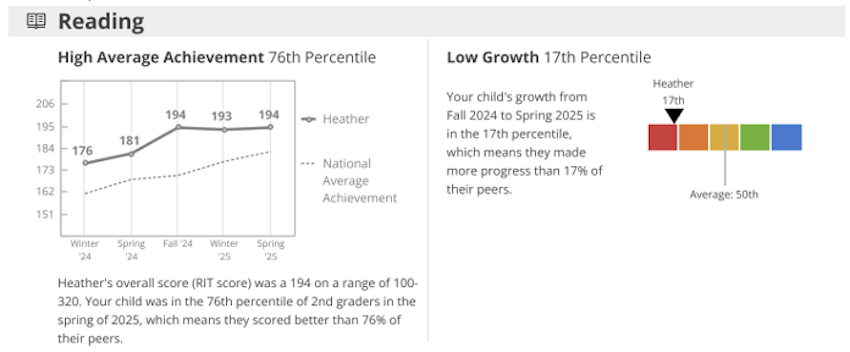
 Alternatively, only talking about achievement, in cases like the next example, ignores the fact that this high-achieving student is growing at a very low rate. In both cases, the focus on growth can orient parents and caregivers around what might be behind the data and the best ways to support their students.
 For more tips on talking about MAP Growth data with families and caregivers, check out our article on using MAP Growth data during parent-teacher conferences.
MAP Growth data is the beginning of the conversation
MAP Growth data is not the final word on student learning—it’s the beginning of a deeper conversation. It provides a valuable and reliable starting point for identifying trends and asking meaningful questions at every level of the education system. Whether you are a district leader, school administrator, classroom teacher, or parent/caregiver, the insights from MAP Growth should prompt reflection, collaboration, and action. By treating the data as a starting point, we can better support all students on their learning journeys.