
“Why do so many of our students meet their growth projections on MAP® Growth™ but fail to ‘meet standards’ on the state test?”
Educators from NWEA partner school districts send versions of this question to me and my fellow researchers often enough that it’s clear there’s a need for better explanations for what we mean by normative growth versus necessary growth when setting growth goals for students.
“Normative growth” and “necessary growth” defined
Normative growth refers to growth projections based on NWEA norms. They show how much growth is average for students over time.
Necessary growth refers to the amount of improvement a student needs to make to reach a desired benchmark, such as “meeting standards” on a state test.
For some students, especially those who begin the year performing below grade level, having normative growth alone won’t be enough. For example, the NWEA 2020 norms document tells us that a sixth-grader with a fall math score of 212 is performing at about the 43rd percentile, relative to other US sixth-graders at that point in the school year. The document also tells us that sixth-graders with fall math scores of 212 show about eight points of growth between fall and spring, on average. Given that knowledge, we can estimate that a sixth-grader with a fall math score of 212, if they show average (or normative) growth, will score at about a 220 in the spring. Eight points is the growth projection, but whether that is sufficient to “meet standards” depends on the standard.
How we partner with states and support teachers
Every state department of education establishes standards or benchmarks on their state tests that define whether a student meets grade-level expectations. NWEA regularly conducts, publishes, and updates state linking studies that provide estimates of the MAP Growth cut scores predicting proficient performance on state tests. We can use these cut scores to predict which students are likely already meeting standards, which students (assuming normative growth) are currently on track to meet standards, and which students must show above-average growth to meet standards.
This excerpt of Table 3.6 from the New York state linking study, for example, shows the spring math proficiency cut score at 227, corresponding to 59th percentile achievement:

If our hypothetical sixth-grader with the fall math score of 212 resided in New York, they would need to demonstrate 15 points of growth by spring to be on track to meet standards. For them, normative growth (so, eight points) would not be sufficient to meet that goal. The student would need to make far-above-average growth, or her teachers would need to allow much more time to get there. These kinds of calculations are done automatically in the MAP Growth Projected Proficiency Summary report, and customized growth goals can also be set for individual students using the MAP Growth Student Profile report growth goals module.
Data designed to help
We provide references to both normative and necessary growth to help educators get the most from their MAP Growth data. Both are important when setting goals for students to ensure that their successes are meaningful and that their aspirations are realistic.
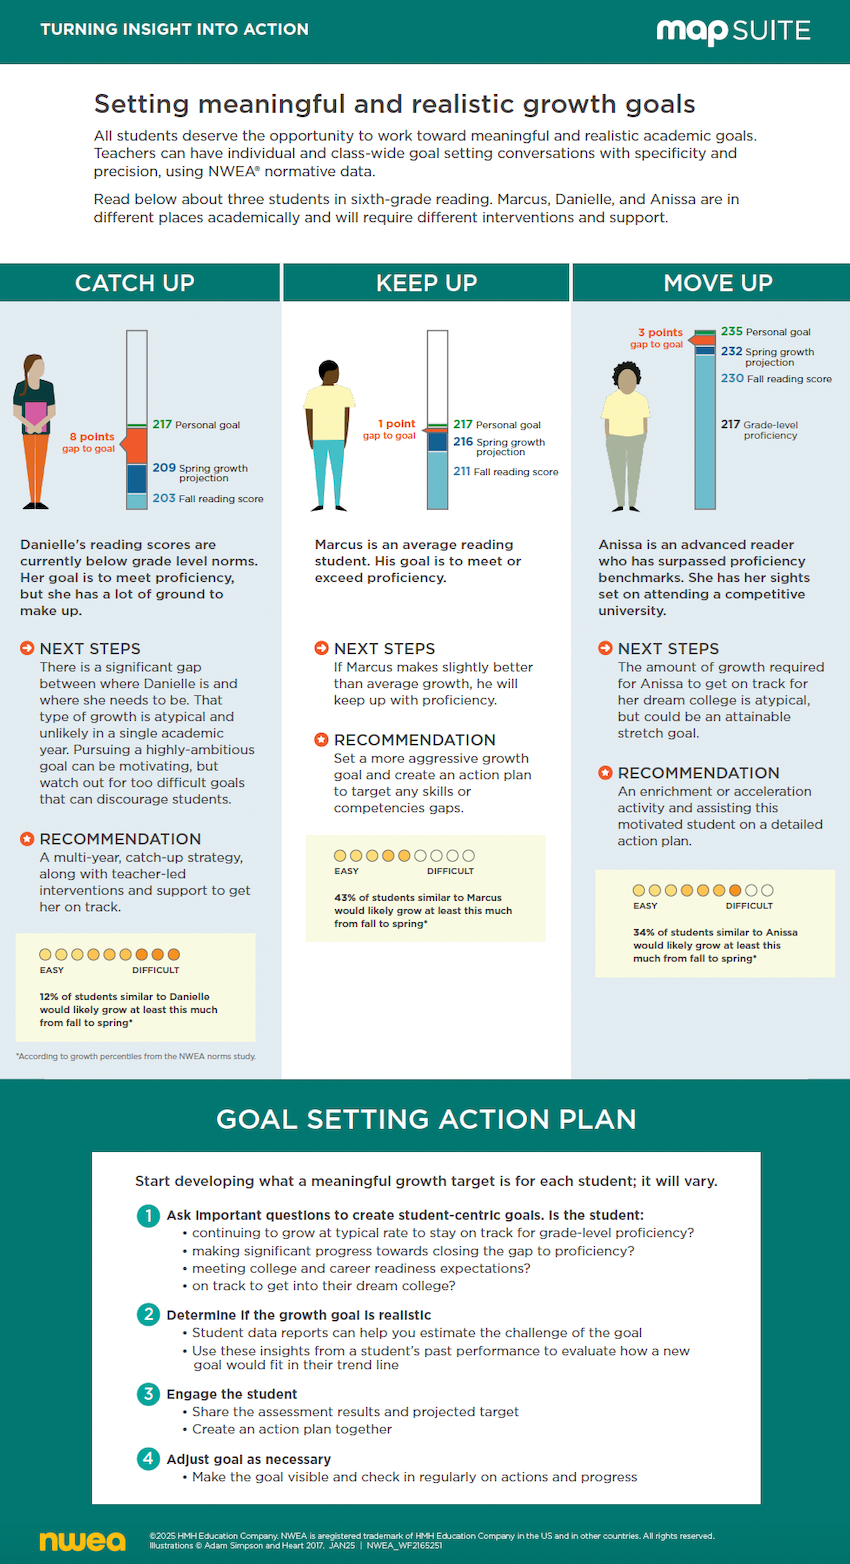
For more guidance on setting effective goals with students, refer to the infographic below and visit our archive of posts about goal setting. To learn more about using MAP Growth in your school or district, contact our sales team.