

As an NWEA researcher, I often answer questions about how to interpret changes in observed scores on MAP® Growth™. Measuring student growth with MAP Growth is a lot like measuring growth in height with a tape measure. A student gets measured once, then after an appropriate amount of time, gets measured again. Any observed changes in the student’s measured height may be interpreted as growth.
What adds complexity to measuring growth on MAP Growth, however, is that the assessment score, called a RIT score, is reported along with a standard error of measurement (SEM), which conveys the margin of error for the measured score. For example, if I produced a RIT score of 214 in the fall, and my SEM was 3.2, my “true score” might have been a bit lower than 214 (as low as 210.8) or a little bit higher (as high as 217.2). The odds are that it fell somewhere in the range of 214±3.2, but I can’t know exactly where. Imagine, further, that I produced a winter RIT score of 212 with an SEM of 3.1. Again, the “true score” can’t be exactly known, but it probably falls within the range of 212±3.1.
So, then, did I grow? The easy answer is that I lost two RIT points because the difference between my measured scores in winter and fall was -2 points. But since there are margins of error on the observed scores, there must be a margin of error for my observed loss, too. NWEA refers to these as growth standard errors.
Understanding growth standard errors
Growth standard errors are related to the individual score SEMs, with smaller SEMs leading to smaller growth standard errors. In the example above, my growth standard error would be 4.46. This means that my “true growth” most likely falls within -2±4.46, or between the range of -6.46 and 2.46 RIT points.
This can be represented visually with a bell curve, as in the figure below, in which the red shaded area represents the range of ±1 standard error around the observed change (the vertical line at -2):
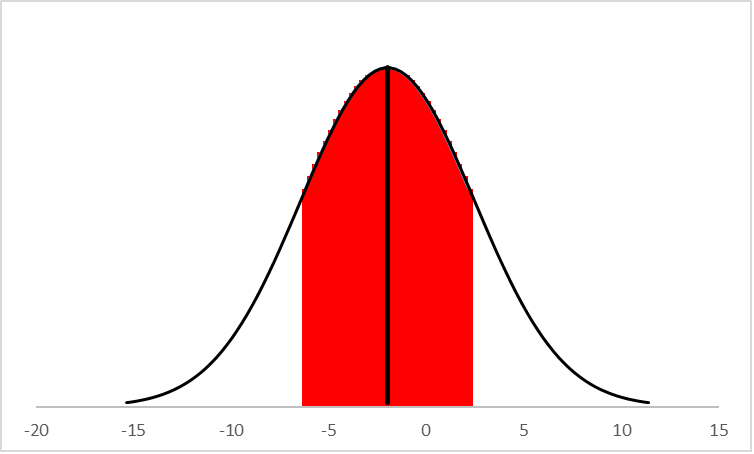
The bell curve displays the possible range of outcomes for my “true growth.” The red shaded area constitutes 68% of the total area under the bell curve, which is another way of saying that we can be 68% certain that my “true growth” falls within that range (between -6.46 and 2.46). But what are the chances that even though my observed score decreased by two points that my “true growth” was positive? Visually, that might look like this:
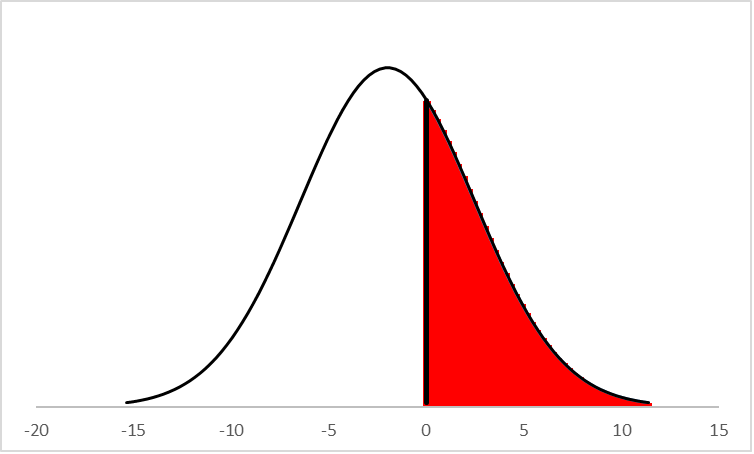
This red shaded area (about 32% of the total area under the curve) represents the possibility that my “true growth” was greater than zero, or positive. In other words, there is about a 32% chance that my “true score” actually increased, despite the fact that my observed scores dropped by two points. There is also about a 68% chance that my “true growth” was negative.
The value of precision
This information is useful in multiple ways. First, it highlights the fact that MAP Growth contains an element of measurement error, which can be expressed in terms of probabilities. In the example above, we saw that my “true” growth score had about a 32% chance of being positive (or that I gained ground) and about a 68% chance of being negative (i.e., that my true score dropped). These kinds of statements are possible for all assessments, of course, but with MAP Growth, the magnitude of error for most students is relatively small compared to fixed form or shorter length adaptive tests. And the smaller the error, the more precisely we can measure small amounts of real student growth.
Another reason this is helpful is because it helps us to correctly understand and interpret negative growth. In my example, the observed change (-2 points) was small, relative to the growth standard error. This means that there was considerable uncertainty (about a 32% chance) that the observed loss was not real. In general, when observed changes are very large relative to their standard errors, we can be much more confident that they are real and not simply artifacts of measurement error. When changes are small relative to their standard errors, we are much less confident that they are real.
Testing conditions matter
All of the examples given so far rely upon a basic assumption, which is that the testing conditions and environmental factors remain consistent across time. If we wanted to measure how much a student’s height increased during a school year, we wouldn’t measure them while barefoot in the fall and then again wearing three-inch platforms in the spring. If we did, we could not be confident that the observed changes in student height were due solely to physical growth. The same principle applies when measuring growth in achievement.
This is a particularly important factor to consider when understanding and interpreting unusually large increases or decreases in student MAP Growth scores over time. In many cases, when a student shows an unexpected drop in score between two test events, the change can be attributed to other factors. Did the student spend too little time on the test? Was the student actively engaged, or were they responding randomly to the items? MAP Growth is designed to invalidate any test where the test duration is six minutes or less, but test durations of 10–15 minutes may be suspect as well. For a student to finish a 40-item MAP Growth test in that time, they would almost certainly need to rush through the test. This could lead to a higher SEM and a lower RIT score.
How to get accurate assessment results
To ensure MAP Growth reliably measures a student’s progress, there are several things you can do:
- Make sure your test proctors are logging start and end times, when possible.
- Have proctors circulate around the room, making notes on student progress. Remember that proctors have the ability to pause and restart a student’s test if they feel the student is not engaged.
- Consider retesting. If a student’s score has dropped significantly (>10 RIT points, for instance), particularly if the test duration also dropped considerably, a retest might be warranted.
- Make use of NWEA reports that show test duration times. A comprehensive data file export shows the test duration times for all MAP Growth tests. Any time you see a test duration under 15 minutes, you should wonder if the student was fully engaged.
- Thoughtfully schedule your MAP Growth testing window. If testing takes place too close to state testing, or too close to winter or spring break or another holiday, it is possible that student engagement will suffer.
- Be careful about promising fun or free time after everyone has finished the test. MAP Growth is an untimed test, but students may tend to rush through it if they know that there is a treat waiting for them once they are all finished.
- Maintain consistency across testing seasons. Ensure the same policies and conditions are applied in all seasons.