
I often facilitate MAP® Growth™ professional learning workshops for high school teachers and administrators, and one of the most frequent complaints I hear is the lack of effort students put forth in taking the assessment. As we drill down to the why, something becomes quickly apparent: students, and sometimes teachers, do not always know why they are taking MAP Growth in the first place.
MAP Growth is designed to help students plan for the future
When I was an assistant high school principal, we had a student in our district we knew would play football at a Division 1 college. His athletic talent was recognized early. However, when he was a junior and took the ACT, he scored a 13. He needed an 18 to get into the Division 1 school.
This student had an ACT tutor and his teachers provided additional support, but he never scored the 18 that was needed. Instead of going to the Division 1 college, he attended a junior college on a football scholarship and then transferred to play at a four-year university. Although he ultimately met his goal, we would have had more time to prepare him for the ACT had we known he was not on track earlier.
Schools that use MAP Growth know it helps teachers get a sense for how their students are doing and that it can inform lesson planning, but they may not know it also supports kids in making plans for after graduation. Most MAP Growth partners are familiar with our linking studies, which use the assessment’s RIT score to predict performance on state assessments. We also have a linking study to multiple college and career readiness benchmarks including ACT, SAT, and the Smarter Balanced Assessment Consortium, often referred to as CCR. ACT metrics are available for grades 5–10, and SAT metrics are available for grade 5–9. The availability of these metrics early provides educators the runway to create goals with students and support them in their ability to be college and career ready.
Helping high schoolers begins in elementary school
MAP Growth data has shown us that students’ academic growth decreases over time and that knowing a student is not on track early is critical to ensuring they are college and career ready by the time they graduate from high school. Take a look at the chart below, which shows the 2020 student growth norms for MAP Growth. Highlighted in yellow are the kindergarten and fifth grade norms.
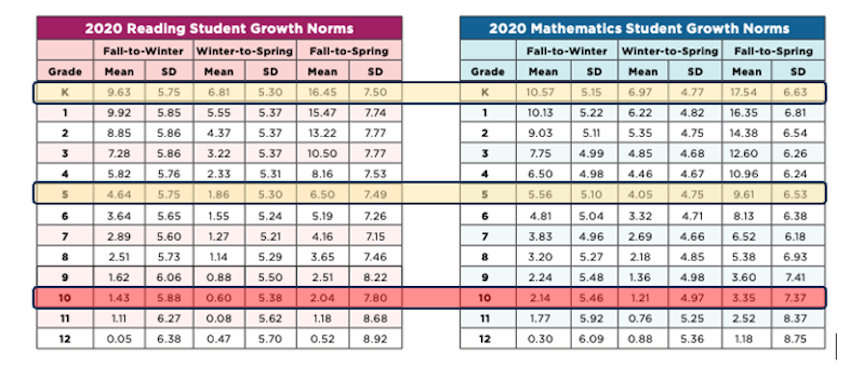
In kindergarten, students typically grow 16.45 points in reading and 17.54 points in math, from fall to spring. By fifth grade, students grow less: 6.5 points in reading and 9.61 points in math. Notice the red highlighted row, which is tenth grade. During their sophomore year, students typically grow only two points in reading and 3.35 points in math.
Proactively plan with students and families
The following tips can help you collaborate with students and families as early as fifth grade to help ensure that kids are ready for the college or career of their choosing after graduation.
1. Help students understand their data
During career planning, help students see the connection between their MAP Growth data and college and career readiness indicators. Use the comparative data to show them that their RIT score is an indication of their readiness. For example, when working with that student destined to play college football, I would have pointed out that projections didn’t indicate he’d get the ACT score he needed to be accepted at a Division 1 school. I would have talked to him about other options, like applying to a community college, but also what he could do to improve his projected ACT score.
2. Help students understand that there are high expectations for career readiness
Not all students want to go to college. There are high-paying jobs available for those without a degree but who have the necessary skills and training, and we must discuss these possibilities with students as well.
The comparative data document shows that CCR readiness is set at the 56th–61st percentile in reading and the 58th–73rd percentile in math. Therefore, students need to understand that they need core skills in whatever their work life demands. When students ask why, give them concrete answers. For example, wood working and home construction require a strong understanding of fractions and geometry. Culinary arts require an understanding of fractions and food science. Farming requires chemistry and a knowledge of proportions.
3. Use the Lexile measures to provide context for reading emphasis
Lexile is a metric that applies to reading materials. The chart below, published by MetaMetrics, shows that the reading materials for technical schools, workplace, and military go beyond the expectations of high school.
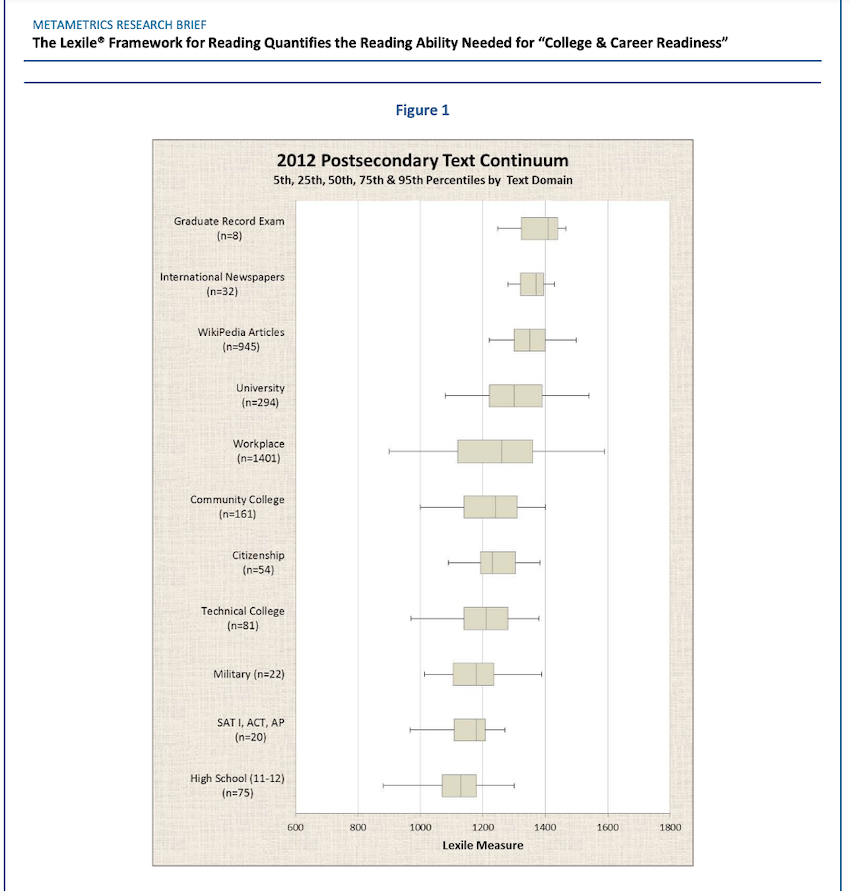
I used a similar chart in my high school classroom. When my students would tell me they didn’t need strong reading skills after graduation, I would show them the chart to prove otherwise.
4. Use College Explorer to understand higher education options
The NWEA College Explorer can help students understand the requirements and costs of a post-secondary education. Consider adding a link to the site on your school’s college and career guidance website.
The College Explorer has three tabs. The first two enable students and families to search for colleges by MAP Growth RIT score or name. Filters let them narrow down the search by region, state, population focus (for example, historically Black schools or those that are religiously affiliated), or predominant degree type awarded. Each college profile includes data from the U.S. Department of Education’s College Scorecard, which includes the cost of attendance and average annual cost to families by income level. It also lists the percent of applicants admitted, the percent of first-year students who return for their second year, and the percent of students who graduate with a degree in six years. The College Explorer includes technical schools, beauty schools and barber shops, and community colleges, although they may not have the alignment to a RIT score.
The third tab of the College Explorer shows the average RIT score by college major and can show students a visual of the trajectory they need to be ready to pursue a specific field of study after high school graduation.
The possibilities are endless
MAP Growth is an excellent tool to support schools and families as they engage students in discussing college and career readiness. Because kids experience more academic growth in elementary and middle school than high school, it’s wise to begin setting goals for college and career readiness as early as fifth grade. Starting early can help more students reach their potential.