

If you want to track student progress over time, it’s critical to use an assessment that offers accurate and precise estimates of student achievement. That precision can be described through a concept called standard error of measurement (SEM). Understanding SEM can help educators and school leaders interpret test scores more effectively and make more confident, data-informed decisions.
What is standard error of measurement?
First, it’s important to remember that all assessment scores are estimates. No matter how well-designed the assessment is, there is always some level of measurement error, meaning we can never know a student’s true score with complete certainty. But we can estimate the range in which that true score likely falls. A smaller range means we have a more precise estimate of the student’s true score.
The size of this range is determined by the standard error of measurement. Smaller SEM means higher precision. When SEM is small, we can detect smaller changes in a student’s learning over time with greater confidence. Larger SEM reduces our ability to distinguish between meaningful progress from random variation.
Standard error of measurement and MAP Growth
When a student takes MAP® Growth™, their RIT score comes with an associated SEM. In many reports, it appears as a score range, like this: Student score range: 185–188–191. This tells us that:
- The student’s observed RIT score is 188. This is our best estimate of this student’s current achievement level.
- The reported range around the observed RIT score is three RIT points lower (185) and three RIT points higher (191) than the observed score. This means the SEM is approximately three RIT points.
We can also use the SEM to determine how confident we are that the student’s true score falls within a given range. There is always a 68% chance the student’s true score falls within one SEM of the observed score and a 95% chance it falls within two SEM of the observed score. So, in this case, we are 68% confident the student’s true score falls between 185 and 191 RIT points; we are 95% confident it falls between 182 and 194 RIT points. This kind of score range is known as a confidence interval.
On adaptive assessments like MAP Growth, the SEM associated with a student’s test score generally decreases—and the score becomes more precise—as the student answers more questions and provides the test with more information about what they know. The figure below shows how SEM, represented by the grey bars, shrinks over the course of a test event. As the test homes in on the student’s achievement with each additional question (or “item”), the possible range of the student’s true RIT score decreases and the score becomes more precise. 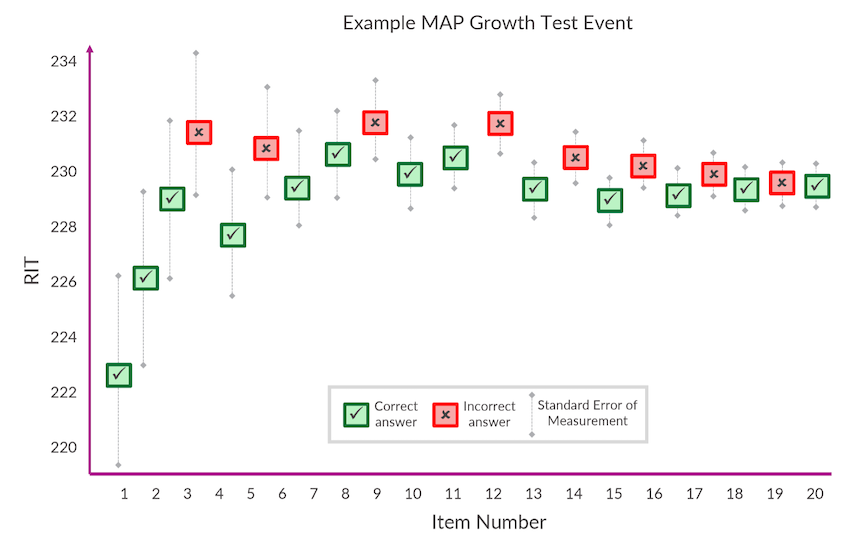 Typical SEM values for MAP Growth are around three RIT points, and these are consistent for students scoring above, below, and on grade level, as well as across most grade levels and subject areas. This consistency is one of the features that makes MAP Growth especially well-suited to measuring student progress.
In contrast, fixed-form assessments—such as many state summative tests—present all students with the same items or items of similar difficulty. These tests are designed to measure a narrower band of achievement than adaptive assessments, which often results in larger SEM for students performing significantly above or below grade level.
Why standard error of measurement matters for educators
Understanding SEM equips educators and school leaders to make informed and statistically sound decisions based on assessment data.
First, SEM provides important context for interpreting test scores. SEM shows how much uncertainty surrounds a score. For instance, if two students score 190 and 188 with an SEM of ±3, their achievement levels may not be meaningfully different based on their test scores. This context helps educators avoid overinterpreting small differences in scores that may not reflect real differences in achievement.
Second, SEM allows educators to evaluate whether score changes over time are meaningful. If a student’s score increases by only one or two points, but the SEM is ±3, that growth may fall within the margin of error. Knowing this helps educators interpret changes in scores with appropriate caution.
Finally, by understanding SEM, educators are better equipped to judge the precision of the data they’re using to make critical decisions—whether they’re grouping students, setting learning targets, or allocating resources. Knowing how much confidence to place in a score is essential to making fair, effective, and data-informed choices.
Other factors impacting assessment accuracy
Standard error of measurement is a key measure of test precision, but other factors also affect test accuracy. Poor testing conditions, student fatigue, or low motivation can all reduce score reliability. In fact, unexpectedly low scores are more often the result of those external factors than problems with the test itself.
To ensure accurate results, it’s critical to use a high-quality assessment, administer it in supportive conditions, and help students understand the importance of doing their best.