 Michelle Wiley is an instructional specialist at Phoenix Central School District in upstate New York and has spent years putting MAP® Growth™ data directly into students’ hands. What she’s found is less a methodology and more a mirror: when kids understand what their MAP Growth data says about them, they start doing something about it.
Michelle has seen immediate gains in buy-in and testing attitude when students own their data. It’s all about reframing the test as a revelation of what they’re good at. And she has the receipts: more completions, fewer makeups, and students following her into the hallway asking for their scores.
We spent two days shadowing Michelle, and as I watch the video of our time with her, four pillars emerge, four new ideas (at least for me) that hold up the foundation of bringing students into assessment data conversations. I’m calling them pillars because that’s what they are; remove any one of them, and the structure gets shaky. Each one comes with a clip of Michelle in action, and a tip you can actually use on Monday.
Pillar #1: Buy-in. When students are invested in their data, their buy-in has a trickle-up effect.
Michelle calls it the “trickle-up effect.” Treat students like learning professionals—give them their data, give them the language to talk about it, and let them into the conversation—and they become advocates.
And then? Students lighten the load for their teachers. Teachers simply cannot personally surface every student’s data story. But when students understand and own their data, they do that work themselves. The trickle up is real. And it starts with giving kids the language and the information to participate.
Try it yourself
Before you bring real student reports into data conversations, practice with a sample. My article “Let’s put the ‘student’ back in the MAP Growth Student Profile report” walks through the four zones of the report reframed as student-centered questions, including “What am I good at?” and “Where am I going next?” Running it through with an anonymous profile first de-electrifies any feedback as you practice reading the report.
Pillar #2: Goal setting. It’s not just about test scores; it’s a life skill.
Goal setting becomes easier when Michelle explains it. She says, “Your data is a compliment. It points out things you didn’t know to flex.”
When an assessment like MAP Growth stops being a verdict and starts being a revelation—a map of what a student’s already good at—the static clears. Students stop dreading the data and start reading it. And once they’re reading it, the goal-setting piece gets easier.
Research consistently shows that learning to set and pursue goals is a skill that transfers into college, into a career, into life. You’re not just helping kids aim for a RIT score; you’re teaching them how to look at evidence, name what they’re good at, identify a gap, and choose a next step. That habit is the whole point, far beyond a school assessment.
Try it yourself
Start with the compliment. Name two areas MAP Growth data shows a student is already strong in before you talk about anything else. Then co-create one concrete next step together. “Concrete” means measurable and explicit, something like:
- Read a book at your ZPD level for 15 minutes three times this week
- Use one vocabulary word from your strengths list in your writing assignment on Friday
- Ask me to show you one problem type from your focus skills list before the next test
- Log five minutes of daily practice in our supplemental math program every day this week
Once you have a general direction, use the MAP Growth Goal Explorer to get concrete. Scroll down to the “Let’s Get Started” section to begin.
Pillar 3: Leverage your students. They deserve professional development, too.
Michelle calls her data-demystifying classroom visits “student professional development.” She’s talking with students, not at them, because she wants them to have the takeaway.
Every kid, at every grade level, deserves to be let in on what their data says about them. What changes is how Michelle makes it tangible.
- Elementary gets the colors: “What does it look like to be a blue?”
- Middle school is a natural fit since interpreting data and trends is already in the math curriculum.
- Upper grades shift toward showing off: “I can access your data, but are you actually using those vocabulary words in your writing?”
What’s essential to note is that the teacher in the back of the room is also watching, also learning. When Michelle runs student professional development sessions, the adults in the room often pick up framing and protocols they hadn’t thought to use themselves.
Try it yourself
Students don’t need the whole book thrown at them at 3:15 on a Friday. Pick one data point that already means something to your students (a color, a score they’ve heard before). Start there. Let curiosity guide what you introduce next.
Pillar 4: De-electrify the data. De-competify the scores and unite your teachers.
Michelle was a teacher prior to her current role and remembers how personal data felt. As we work to help students feel more positive about their data, teachers may need a little love as well.
MAP Growth data is most legible and most commonly used at the class, school, and district level. That’s where it’s designed to show trends, flag patterns, and surface where a grade or a building needs support. At 30,000 feet, it’s a powerful tool. Also, at that altitude, it’s too global to be personal. It tells you where the group is, but it doesn’t tell you what to do with the kid in front of you right now. That’s the gap Michelle’s “data digs” are designed to close and, interestingly, the shift from the bird’s-eye view down to the student level has an unexpected side effect on teacher culture.
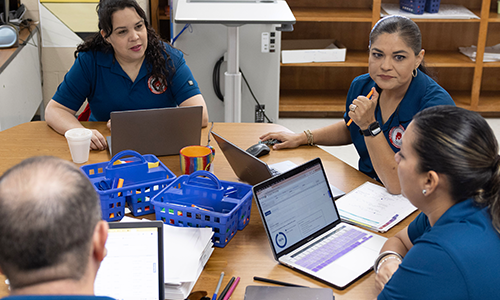
Michelle recommends these data round-table conversations to leave behind the “My kids, my results” attitude. Watch below as she moves toward tuning in, zooming out, and Indiana Jonesing together.
Try it yourself
The easiest first step in a data dig is reading someone else’s data. “Data detectives: The case of the informational text” follows a sixth-grade team solving a reading puzzle together. It’s low-stakes (not your data, and not your monkeys!) and a good way to get a team comfortable asking questions before the numbers are their own.
Case in point: BJ, fifth grade
Let’s see this hypothetical, student-driven data conversation in action.
When Michelle started going through BJ’s data with him, in language he could understand, he started checking his scores after each test. He felt ownership over his performance because he finally knew what he was working on.
The day the film crew was there, kids were going around the room asking each other what their strengths were. Then they turned and asked BJ.
Learn more
To learn more about MAP Growth, visit our website. And for more ideas on putting data to work in your classroom, see the archives for articles on goal setting and using assessment data here on Teach. Learn. Grow.