
If the science of reading were to invite me to a dinner party, I betcha I can tell you who else would be there: data-based decision-making. That’s because the science of reading and data-based decision-making are besties.
The science of reading is about the converging evidence of what matters and what works in helping students to read with comprehension. A key piece of that is data-based decision-making. We can decide to implement practices with a good evidence base, but next we need ongoing data cycles to make sure what we’re doing is really working with our particular learners.
Questions versus decisions
Lots of us bring questions to our data, like “Where are most of my students growing least well?” But once we find an answer in our data, we can’t stop there. That would be like printing a big red poster that says, “Collect data and carry on,” a terrible new take on the British meme. Looking at data and then carrying on as usual: That’s not solving a problem. That’s just admiring it.
Instead, let’s use data to inform real decisions. A real decision involves deciding which action to take, contingent upon what the data tells us. In implementing the science of reading, we make different kinds of decisions. We make decisions about resource allocation, about immediate instructional planning, and about program improvement. Let’s think some more about each of these.
Resource allocation decisions
In a better world, we would be able to offer extra intensity or special programming to every student. But resources are limited and it’s still us school folks who are running most of the bake sales. This is why we identify subsets of students eligible for extra support: Title 1 services, Tier II intervention, summer school, tutoring, even some talent enrichment programs.
We are deciding this: Who gets allocated something that not everyone can get?
Screeners are key in helping us decide who might need intervention resources. We determine a cut-point to identify students as demonstrating some risk of poor reading outcomes, and we consider allocating intervention resources to those below it. In MAP® Reading Fluency™, this risk is clearly indicated by a flag on the Screener Outcomes report.
An important part of resource allocation is figuring out who gets which: when a student is flagged as showing some risk, it’s time to ask where to focus intervention efforts. Not every student should be put into a phonics intervention; for some students, a focus on vocabulary and oral language development might be indicated instead. On the MAP Reading Fluency Screener Outcomes report, comparing a flagged student’s foundational skills domain scores for a lowest area makes it straightforward to find an intervention focus.
Instructional planning decisions
While our standards and our curriculum guide our instruction, we know that making adjustments based on student learning is key. This involves checking whether the class as a whole is ready to move on, but it also involves deciding where to differentially teach skills and scaffold in response to individual student needs.
Boiled down to a question, we are deciding this: How should I adjust my instruction in the near term?
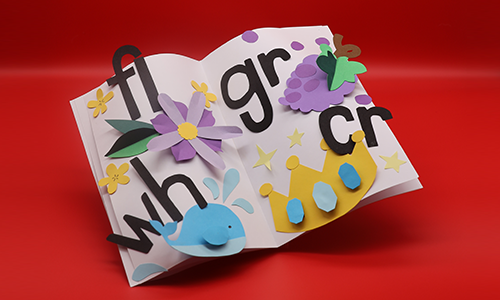
In deciding which skills and concepts we need to teach differentially and to whom, assessment data that locates each student in a progression of skills is key. On the MAP Reading Fluency Instructional Planning report, each student’s performance is associated to a zone of proximal development (ZPD) level in phonics, for example, showing which students are working on using basic letter sounds in words and which are ready for multisyllabic words with a variety of phonics patterns. Using flexible and skill-focused small groupings can help explicitly support what kids need next.
When it comes to scaffolding, we know that all students have a right to instruction in grade-level content; we don’t drop our expectations, for example, to only expose them to below grade-level text.
While some students can show more independence in reading the rich grade-level texts we want to discuss, others will need more significant scaffolding. With MAP Reading Fluency, a student’s Lexile oral reading score is compared to typical grade-level text demands, making clear which students will benefit from more significant scaffolding. Try vocabulary previews, repeated readings for fluency before analyzing text structures, and even read-aloud support to make sure all students are given access to those complex grade-level texts.
Program improvement decisions
So we’re teaching using evidence-based practices, we’ve set up our interventions, and we’ve found ways to differentiate and scaffold. How’s that working for us? I’m not making a Dr. Phil–style statement; that’s truly something our data can help us answer. We don’t want to do data-based question-answering only, though; we want to follow through with real decisions, where our data drives different actions depending on what we find.
Decisions of this type answer this: Where do we need to improve, and where can we replicate what’s working well?
Performance against standards-based grade-level expectations is one way states in particular gauge areas of success versus areas for improvement. With MAP Reading Fluency, student performance can be compared to seasonal grade-level expectations via performance levels: below, approaching, meets, and exceeds are each shown with their own color. If most students are failing to meet expectations in phonics in my school, it’s time to bolster that area in Tier I instruction.
Growth analysis is another critical way to evaluate what’s working well and not so well. With MAP® Growth™, a change in a RIT score can point to where instruction is more or less successful at causing gains. In MAP Reading Fluency, the counterpart to a RIT score is at a finer-grained level: we can look at change on a scaled domain score in phonics and word recognition separate from change in the phonological awareness domain, for example. We can find that the first-grade classrooms at Friends Elementary are making greater growth in phonics than those at Scholars Elementary, and we can find ways to replicate Friends’ success. Decisions at this aggregated level might involve spreading good professional learning or supplementing or changing a curriculum.
Growth analysis at the individual level is critical as well. When a student is receiving an intervention, we can progress monitor to watch how the student is responding with growth. If that response isn’t on the right trajectory to meet our goal, then we are signaled by the data to intensify and improve that intervention.
Science, art, and data-informed decision-making
I’ve been pushing the idea that the science of reading and data-based decision-making are best friends forever: SOR + DBDM = BFF. A commitment to what matters and what works involves an ongoing commitment to evidence, so these two are highly simpatico.
But, yeah, it’s kind of a bad metaphor. We all know that the best BFFs are humans and that the best dinner parties involve real people. (I mean, can the SOR or DBDM even make appetizers?)
In the real world of real decisions about real kids, it turns out that humanity matters most of all. Just as we bring creativity and compassion to our teaching, so do we bring deep care and context and community to our decision-making process. The science of reading needs our art of teaching. Data can only inform our decisions, not make them.
Let’s support each other out there, Team Humans: we are what our students need most.