Keeping a pulse on the big picture
Teaching and learning take place against the landscape of larger work that changes, informs, and influences what happens in our districts, schools, and classrooms. Stay informed with our collection of updates from our exceptional team of education researchers.
WEBSITE
Expanding educational opportunity through research
Research at NWEA starts with our student growth database—one of the most extensive of its kind in the world. We then partner with universities, think tanks, grant-making agencies, and other stakeholders to expand the insights drawn from that data.
WHITE PAPER
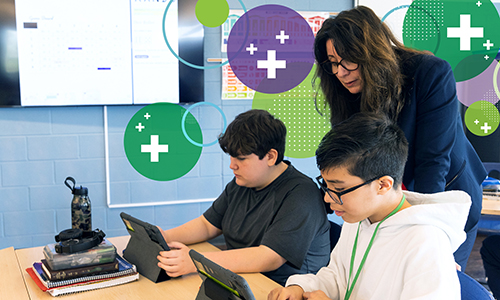
Why NWEA prioritizes research and innovation
The goal of assessment is to make informed decisions about how to support students with personalized instruction. To maximize the validity and value of these assessments, NWEA maintains an ambitious program of research and development.
RESEARCH REPORT
Consider the evidence on academic recovery
When it comes to assessing post-pandemic learning recovery, evidence of how kids are doing can depend on where you’re getting your information.