
 Drop by any running trail on a nice weekend morning, and you’re likely to find someone training for a marathon—tracking their pace, counting laps and miles, maybe even measuring their heart rate. While these data points are invaluable to the aspiring marathoner, they don’t tell the whole story of the runner’s journey or the progress they’ve made.
Ever mindful of the fact that education is a marathon, not a sprint, the folks behind the interim assessment MAP® Growth™ are always thinking about the stories that need to be told about assessment data—along with who needs to hear those stories and how to make complex data relatable. Students’ Rausch unit (RIT) scores and achievement percentiles are key pieces of information in the classroom, but how can educators help students and their families use these numbers to share a comprehensible story at home?
Enter the MAP Growth Family report: a translational tool for presenting a student’s achievement, growth, and projected proficiency in a format accessible to any family member. Covering reading, science, language arts, and math, the Family report shows key assessment results, organized by term.
This article will walk you through what’s in the report, how to access it, and how to use it to have meaningful conversations with families of students at any grade level.
What’s in the MAP Growth Family report
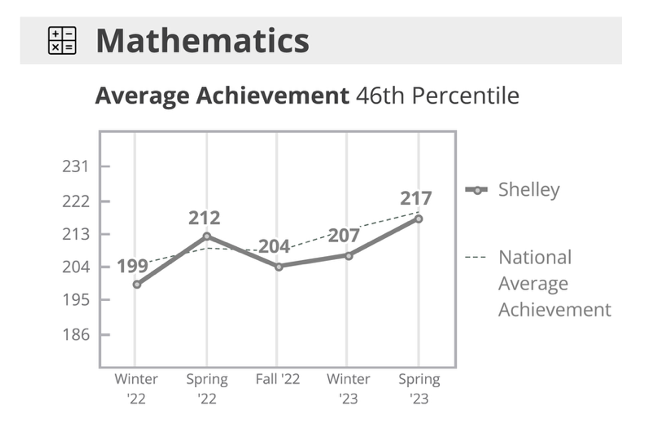
Let’s start with a quick overview using a fictional student, Shelley, as an example. Upon first glance, Shelley’s family will see that the report is organized by subject and two side-by-side panels describing her achievement and growth.
Achievement shows Shelley’s RIT score at a single moment in time and places her in a percentile compared to same-grade US students. (Shelley’s percentile of 46% means she scored higher than 46% of her peers.)
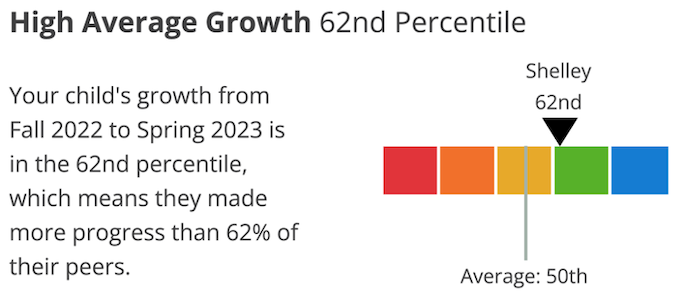
Growth shows how Shelley’s performance changed across two moments in time (in this example, fall and spring). Again, a percentile is given to show Shelley’s rate of progress relative to her peers.
The report also includes important details about projected proficiency so that Shelley’s family can get a reality check on their student’s readiness for future tests and college. Based on her achievement and growth, the report might inform the family that Shelley is likely to be “below proficient” on the NWEA Generic Linking Study, “not on track” on the ACT College Readiness, and “not on track” on the SAT.
These projections can raise a lot of questions and concerns for families. That’s why, at the bottom of the report, families will find a small goldmine of questions they can ask teachers, including, What kinds of strategies are you using that I might be able to reinforce at home? Does my child need help in any specific areas? When will I get another update on my child’s growth?
Achievement and growth: The core distinction
Jenna Talos, an NWEA professional learning consultant, makes an interesting observation about the Family report: Even though achievement and growth are given equal space, “Families go right to achievement every time,” she says.
It’s not hard to understand this emphasis on achievement scores. Families want to know whether their child is ahead of their peers, keeping up, or falling behind. But as Jenna points out, it’s important for families to understand that a major benefit of MAP Growth is that it tracks growth over time—“not from point A to point B but, rather, from point A to points E, F, and G.”
Depending on subject area and student performance, a complex picture of achievement versus growth may emerge from the assessment data. Here’s how families can begin to make sense of some of the most common achievement/growth combinations they may encounter:
- High achievement, high average growth. “These are your elite athletes. They’re at the top of their craft,” says Jenna. They can still improve, of course, but their gains may be incremental and subtle.
- High achievement, low growth. This combination can lead to some sensitive conversations. The student may be getting high scores now but gaining ground more slowly than their peers. That’s not necessarily a problem, but a parent might ask, “Why is the word ‘low’ attached to my child’s name?” Teachers can help them understand that low growth is simply a moment-in-time signal and does not indicate failure.
- Low achievement, high growth. This is the most encouraging trajectory, as it suggests solid progress toward passing the 50th percentile. If a student in this category maintains high growth, they’ll eventually land in a higher achievement category.
- Low achievement, low growth. This can be a difficult conversation for teachers and families alike, as it understandably prompts questions about what’s going wrong. Remember that low growth doesn’t say anything definitive about a student’s knowledge; instead, it could reflect any number of factors, from classroom engagement to health issues to circumstances on test day.
Here’s Jenna’s key message for families: The RIT score is not a grade, and the MAP Growth Family report is not a report card. “It’s not an assessment of mastery, it’s not one and done, and it’s not make or break,” she says.
Family conversations across grade bands
As students make their learning journey from kindergarten to high school, the MAP Growth Family report is there to facilitate family–teacher conversations along the way. Of course, the nature of these talks will change a great deal during that time. Here are some quick tips to inform these important discussions:
- Early elementary. At this stage, the report is simply a baseline—an initial data point that shows where students stand academically. If the report comes after the very first test, the growth section will be blank and is an opportunity to set expectations that the student’s story will build over time and families will see more detail as the picture fills in. Tip: To help families understand the intended scope and purpose of the report, use language like “trajectory” rather than “score.” Early tests represent a starting point, not a finish line.
- Upper elementary into middle school. As students move toward departmentalized classes, the subject-by-subject breakdown becomes more actionable. Which subjects are strengths, and which need attention as the student transitions? Tip: Talk with families about the importance of reading data at this stage. Has the student made the transition from learning to read to reading to learn?
- Middle and high school. Projected proficiency for ACT and SAT becomes central at this stage. Be sure to discuss this portion of the report and use it to anchor the college-readiness conversation. Tip: For fifth graders and above, the linking study projection can show whether a student is on or off track for college readiness.
How and where to share the report
At some schools, sharing the MAP Growth Family report with families may be treated as a compliance item: a box to check, a task to complete. The report may be sent out via mail, email, or online portal, with inconsistent follow-up. Families can get a lot of value from the Family report regardless of how it’s shared, but there’s a big difference between compliance data-sharing and comprehensive data-sharing.
Whenever possible, schools should strive to have comprehensive conversations with families that allow for dialogue, face-to-face communications, and airing of questions and concerns. While the Family report is designed to be approachable, it does contain some specialized language—and families benefit from having someone walk them through it.
Teachers should remember that an expectation of conversation is baked right into the report itself, with the “How can I use this information to help my child?” questions that appear after the achievement and growth numbers. Educators should be ready to engage with families on these questions and any others that come up.
Getting started
From start.mapnwea.org, log in and navigate to “Batch Print for Family Report” in the MAP Growth section.
With this report generator, you can produce a batch of PDF Family reports to share MAP Growth results during conference discussions with families, or to print and send home with students. Depending on your role and needs, the batch print feature gives you multiple reporting options:
- A single student
- Multiple students within a class
- A single, entire class
- Multiple classes in a single school
- A single, entire school
- Multiple schools within a district
Meeting families where they are
The MAP Growth Family report is simple by design. It’s not as data dense as other MAP Growth reports because it’s built specifically for families who want detailed information about their students without getting bogged down in jargon or statistics. The simplicity of the Family report gives educators a clean, accessible entry point for talking to families about data that matters.
For more resources and ideas for engaging families in conversation about student performance and growth, check out the Family Toolkit.