 Here’s a scenario that might sound familiar: You’re setting goals for your students and notice that Neva, who’s currently performing well below grade level, would need to grow significantly more than the average student to reach proficiency by spring. Do you set a “realistic” goal for her based on typical growth patterns or aim for the more ambitious target she actually needs?
This is the heart of one of the most important—and frequently misunderstood—aspects of using MAP® Growth™norms effectively. As we continue our series of articles on the 2025 norms, it’s time to tackle a critical distinction: the difference between growth that’s realistic and growth that’s meaningful.
Remember, norms tell us what’s typical. But typical isn’t always enough. Understanding when to aim beyond typical growth patterns, and how to do it thoughtfully, is key to setting goals that truly serve your students.
The power of personal growth goals
One of the biggest sources of confusion around MAP Growth norms comes from mixing up what they actually tell us. Norms describe typical patterns of student achievement and growth across the country. In other words, they tell us what is.
But here’s what norms don’t do: They don’t prescribe what ought to happen. They don’t define what’s “good enough” or tell us what students should achieve. Just because growth is typical doesn’t mean it’s sufficient, and just because it’s below average doesn’t mean it’s failing.
Think of it this way: Knowing that the average mile time for runners in your age bracket is nine minutes tells you what’s typical. But that’s very different from knowing what mile time would qualify you for the Boston Marathon. The average describes what most people do; the qualifying time prescribes what you need to achieve a specific goal. Both pieces of information are useful, but they answer completely different questions.
The same logic applies to student achievement and growth. Norms give us the “what is” picture, showing us how students typically perform and grow. To understand what’s meaningful for individual students—whether typical growth is enough to help them reach important academic milestones—we need additional information. That’s where linking studies and proficiency projections come in, helping us understand not just what’s typical, but what’s necessary to get students on track for success, too.
Realistic growth: What’s typical based on where a student starts
MAP Growth norms show us what’s realistic by revealing how students with similar starting achievement levels typically grow over a school year. This is incredibly valuable information because it grounds our expectations in evidence rather than assumptions.
Students don’t all follow the same growth trajectory. They show different patterns based on where they begin. For example, a third-grader starting the year at the 20th percentile typically grows at a different rate than a third-grader starting at the 80th percentile. The norms capture these differences, giving you a much more accurate picture of what to expect than a one-size-fits-all approach would provide.
This realistic picture helps you avoid two common pitfalls: setting goals that are so ambitious they are unachievable and become demoralizing, or assuming all students should grow the same amount regardless of where they start. When you know that students similar to yours typically grow 12 RIT points over the school year, you can set goals that stretch students appropriately without setting them up for frustration.
Realistic growth expectations also help you identify when something noteworthy is happening. If a student is growing much faster or slower than peers with similar starting points, that’s worth investigating. It might signal effective instruction, emerging challenges, or changes in the student’s circumstances that warrant attention.
But here’s the crucial point: realistic doesn’t always mean sufficient. Understanding what’s typical is just the starting point for goal setting, not the finish line.
Meaningful growth: Moving toward proficiency or other targets
The reality is that sometimes students need to grow more than what’s typical to reach meaningful academic milestones. Remember, norms describe where students are, but they don’t prescribe where students should be. To understand what’s meaningful, we need additional information about academic targets and long-term goals.
This is where linking studies become essential. NWEA conducts studies that connect MAP Growth RIT scores to state proficiency standards, showing what RIT scores typically correspond to meeting grade-level expectations on state assessments. These studies help bridge the gap between current performance and meaningful targets.
But here’s what makes this complex: state standards vary significantly. What constitutes “meaningful” growth depends entirely on the standards and expectations your students are working toward. A RIT score that puts a student on track for proficiency in one state may be well below the target in another state with more rigorous standards.
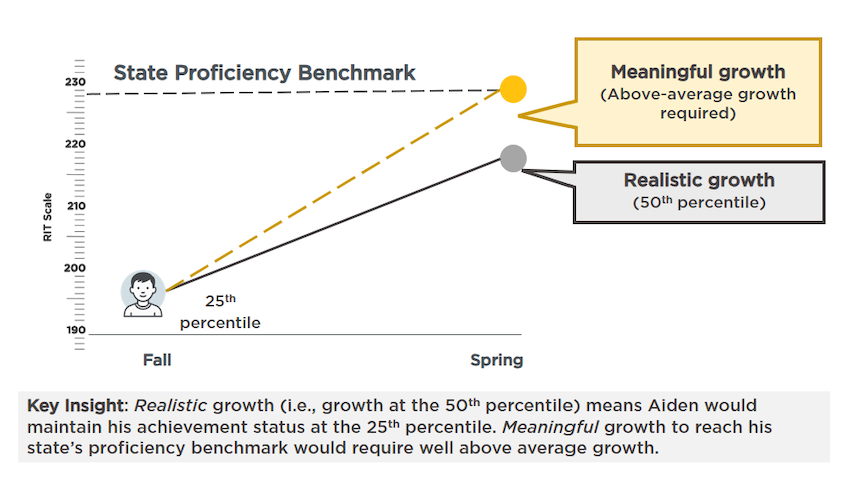
Let’s say Aiden, a fourth-grader, is currently scoring at the 25th achievement percentile nationally. But in his state, his spring score needs to be at about the 65th percentile to be on track for proficiency. Importantly, typical growth results in maintenance of achievement status. So even if Aiden makes his growth projection (which is based on average growth), that means he will still be at the 25th achievement percentile come spring. The growth required to get him to the 65th percentile would be well above average, maybe as high as 90th percentile growth, meaning he’d need to outgrow 90 percent of students who started at similar achievement levels. This isn’t impossible, but it’s exceptionally ambitious and might be more realistic as a multiyear goal requiring consistent above-average growth.
The figure below illustrates Aiden’s situation and the gap between realistic and meaningful growth trajectories. This example illustrates the tension perfectly: what’s realistic based on norms and what’s meaningful based on proficiency targets can be very different things.
 Balancing the two
So how do you navigate the tension between what’s realistic and what’s meaningful? The answer lies in using norms as a starting point for informed decision-making, not as a ceiling for student potential.
Start with the realistic picture that norms provide. Understand what’s typical for students with similar starting points and use that as your baseline for goal-setting conversations. This grounds your expectations in evidence and helps you avoid goals that are either too low or unrealistically high.
Then layer in the meaningful targets. Look at proficiency projections and consider what kind of growth would help students reach important academic milestones. If there’s a significant gap between realistic and meaningful growth, that’s valuable information that tells you where additional supports, interventions, or instructional adjustments might be needed.
Remember, proficiency projections aren’t destiny. They’re best used formatively to identify students who may need extra support to stay on track, not as fixed predictions about student potential. In fact, we want them to be wrong when they suggest a student won’t reach proficiency. The goal is to provide that support and prove the projection wrong by helping the student exceed expectations.
As the teacher, you make the call about how to balance these considerations. You might decide that for some students, realistic growth is appropriate given their circumstances and needs. For others, you might choose to aim for more ambitious targets, knowing a student will require additional support and monitoring. The key is making these decisions intentionally, with full awareness of both what’s typical and what’s needed.
At the end of the day, we want you to use norms to inform your professional judgment, not replace it. MAP Growth norms are powerful tools for understanding patterns and setting context, but they work best when combined with your deep knowledge of individual students, available resources, and instructional priorities.
To learn more, read our articles “Same scale, new reference: What’s new in the 2025 MAP Growth norms” and “What can you do with the 2025 MAP Growth norms? Turning test results into action” and watch our on-demand webinar and our video titled “MAP Growth norms: How NWEA measures growth and achievement.”