
 Summer slide (also referred to as summer learning loss) describes how students lose or forget academic skills from the previous school year over the summer. As a result, many students’ test scores in the fall are slightly lower, on average, than their scores from the prior spring.
Why does the summer slide occur?
When students are not actively using knowledge and skills acquired in school, it is normal for them to forget some of what they have learned. But that’s not to say that students will forget everything they learned in just a few months of summer break. Certain types of knowledge and skills are more likely to fade. Specifically, procedural skills, vocabulary, isolated facts, and multi-step tasks tend to be especially sensitive to gaps in practice.
How do we measure summer slide?
Summer slide is typically measured as the difference between students’ spring and fall test scores. These estimates are quite sensitive when students test in the fall and spring.
In the results presented in this article, we used the 2025 MAP® Growth™ norms to estimate the expected RIT score change for students near the end of the school year in the spring (week 36) and the beginning of the next school year in the fall (week 1). When testing occurs earlier in the spring or later in the fall, spring-to-fall test score changes capture some school year learning in addition to the summer break period, which reduces estimates of summer slide. In a subsequent Teach. Learn. Grow. post, we will provide guidance on how to estimate summer slide using your own data, accounting for testing time.
What is “typical” summer slide on MAP Growth?
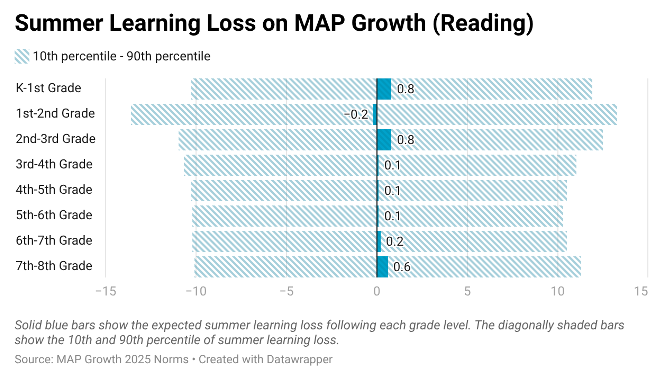
Figures 1 and 2 below present estimates of summer slide in math and reading and how much it varies across students according to the national 2025 NWEA MAP Growth Norms model. The solid blue bars show the average summer RIT score changes, while the striped light blue bars show the 10th and 90th percentile estimates of summer RIT score change (i.e., the upper and lower extremes in terms of summer slide).
Figure 1. Typical summer slide in math according to the 2025 MAP Growth norms
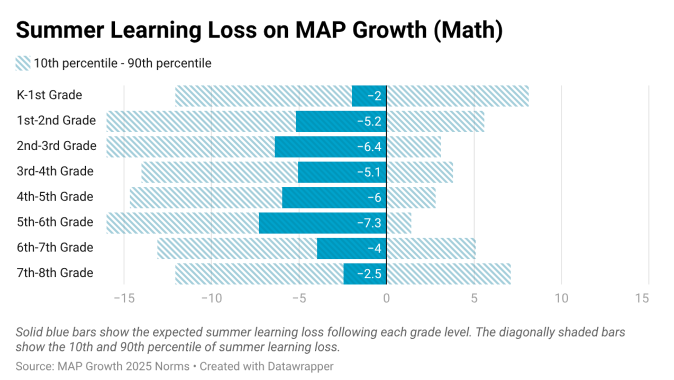
Figure 2. Typical summer slide in reading according to the 2025 MAP Growth norms
On average, students’ math scores drop between two to seven RIT points during the summer, with the biggest drops in elementary school grades. These summer declines are roughly equivalent to 10 to 30 percent of what students learn in a typical school year.
In reading, the pattern is quite different. The average student’s score is essentially unchanged between spring and fall, with differences of less than one RIT point.
While these averages are informative, they do not capture the full range of students’ experiences over the summer. There is substantial variability in summer learning patterns, even among students in the same grade. Some students experience large declines, while others show little change, and some make meaningful gains over the summer. In both math and reading, the 10 percent of students who experience the most summer slide (i.e., students at or below the 10th percentile for summer learning gains) are dropping by the equivalent of more than a year’s worth of typical school-year gains in most grades.
Why do we see less summer slide in reading?
Prior reviews of research have found that missing school (whether due to summer break, school closures, or absenteeism) typically results in bigger declines in math scores than reading. One possible explanation is that kids may be more likely to engage in reading outside of school than to practice math. Additionally, math learning relies on procedural skills that may fade from memory more quickly than the skills involved in reading.
Our estimates of reading summer slide reported above are also smaller than earlier (pre-pandemic) estimates based on MAP Growth. These differences may reflect both a reduction in summer slide since the pandemic and differences in how summer slide was measured across studies. Estimates of summer slide are sensitive to analytic choices, particularly how researchers account for any learning that occurs between spring and fall testing. In our calculations, we conservatively assume that students are not learning a substantial amount after spring testing, around the 36th week of school (most school years are about 40 to 42 weeks long, including breaks). If students make significant progress after that point, our approach will underestimate the amount of summer slide they experience. (For more on the importance of instructional time and assessment, read “Getting precise: Why instructional time matters for fair comparisons on student achievement.”)
What are the consequences of summer slide?
Students who experience substantial summer slide may begin the school year less prepared to engage with grade-level content. Although many teachers report spending the first month of school reviewing prior material to catch students up, this review period may not be sufficient for students who have experienced larger declines.
The variation in summer slide also means it is important not to assume that all students require the same level of review or intervention at the start of the school year to get back to where they were in the spring. For that reason, it is ideal to inform or update instructional decisions based on fall test scores, as opposed to relying solely on spring results.
How can families and educators help?
Families and educators should think about summer as an opportunity to provide students with additional learning opportunities that help students maintain and build skills. Districts should support families in this effort by offering or connecting families to high-quality summer learning programs, particularly for students who are struggling during the school year.
Beyond structured programs, families can encourage regular reading, practice math skills, and take advantage of community resources that provide free or low-cost activities, such as libraries or parks and recreation centers. Schools and educators can help connect families to age-appropriate resources to support these practices.