 As we continue our series on the 2025 MAP® Growth™ norms, it’s time to highlight one of the most powerful, but often overlooked, features that sets these norms apart: their precision around instructional time.
Many assessments take a blunt approach to timing, for instance, grouping all fall testers together regardless of whether they tested in late August or early October. But “fall” doesn’t mean the same thing for every district or even every school in a district.
MAP Growth takes a more nuanced approach by accounting for the actual number of weeks of instruction a student has received before testing. After all, we wouldn’t expect a student who hasn’t had any instruction to perform at the same level as someone who’s had seven weeks of math class. So why would we interpret their test scores the same way?
Why instructional time matters
Imagine three students—Riu, Dahlia, and Kari—all in third grade, all earning the same RIT score of 175 on their fall MAP Growth math test. Same score, same grade, so they’re achieving at the same level, right? Not necessarily. Riu’s school tests right at the start of the year, in week 0. Dahlia’s school tests in week 4. Kari’s school waits until week 7. Technically, all three students tested in the fall, but they’ve had very different amounts of instructional time.
Under the 2025 norms, a RIT score of 175 in third-grade math corresponds to different percentile rankings depending on the amount of instruction: it’s at the 33rd percentile at week 0, the 28th percentile at week 4, and the 25th percentile at week 7. These differences have real implications. Many districts use the 30th percentile as a cut score to identify students for intensive intervention. So Riu, who tested early, wouldn’t be flagged for additional support. But Dahlia, who tested just a few weeks later, would fall below the threshold. Kari, who tested even later, would fall further still.
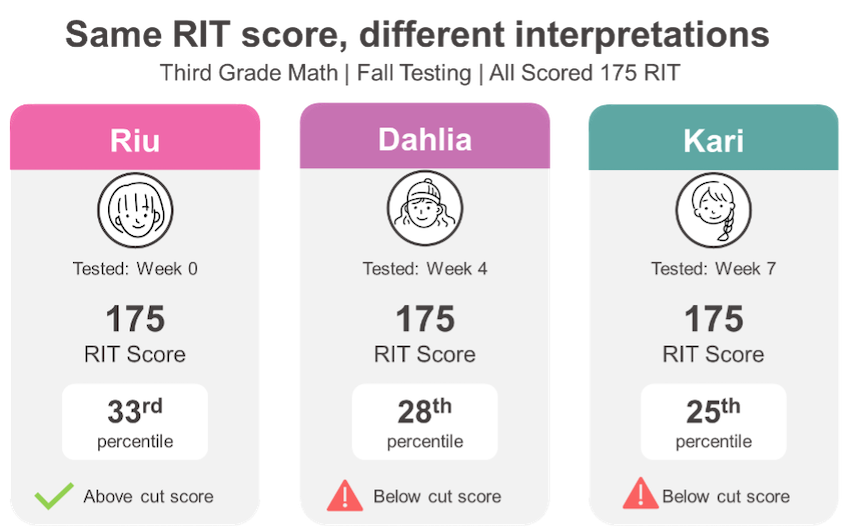 Each of these students got the same score on the same test in the same season, but the timing of their assessment could influence whether they are flagged for intervention, how their teachers interpret their progress, and how their families understand their needs. This is why accounting for instructional time isn’t just a technical feature, it’s also essential for fairness and accurate decision-making.
The challenge: Default settings can lead to misinterpretation
Here’s where many districts unintentionally run into trouble: they rely on default instructional weeks while giving schools flexibility in when they actually test.
It’s an understandable shortcut. Testing logistics are complex, and standardizing settings across a district can feel like a practical way to manage them. Often, the defaults—week 4 for fall, week 32 for spring—are set once and left alone. However, when districts use the NWEA default instructional weeks but allow schools flexibility in their actual testing dates, the data can become misleading. Consider a district that sets fall testing for instructional week 4 across all schools but allows a four-week testing window. The system assumes all students tested after four weeks of instruction, when in reality, some had just two weeks and others had six.
These differences may sound small, but they can distort both achievement percentiles and growth metrics, leading to interpretations that don’t reflect what’s really happening in classrooms.
The impact on your data
Let’s take a closer look at how this plays out in practice. Imagine Valley View School District uses the default instructional weeks within the MAP Growth system: week 4 for fall and 32 for spring. However, it’s common for defaults to stay in place even when school testing schedules vary.
The illustration below shows how this mismatch plays out. Both Adams and Grant schools appear to be using the same default instructional week settings, but in practice, students end up testing on very different dates—often because defaults are left in place without aligning to actual testing schedules. In this example, Adams tests in weeks 2 and 34 while Grant tests in weeks 6 and 30. This creates an eight-week difference in actual instructional time. That difference can significantly impact percentile interpretations, even if the test scores themselves don’t change.
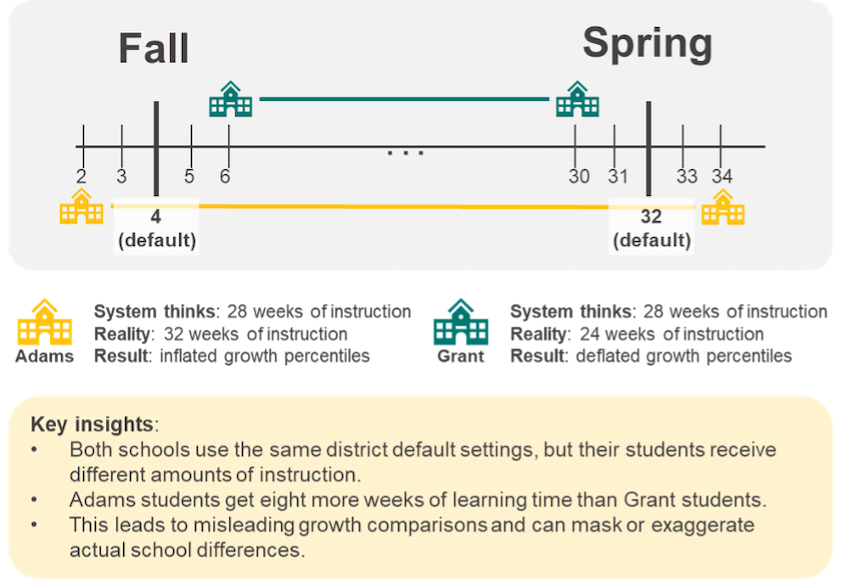 At Grant Elementary, students actually take the fall test in week 6 and the spring test in week 30. That means they’ve had more instruction than the system assumes before their fall test, but less instruction between fall and spring. As a result, their fall achievement percentiles may appear slightly higher than they should because the system is comparing their scores to students who had less time to learn. But when spring rolls around, the opposite happens: growth percentiles may seem lower than expected because the system believes students had a full 28 weeks of instruction to grow, when in reality they only had 24.
Meanwhile, over at Adams Elementary, students take the fall test in week 2 and the spring test in week 34. In this case, they’ve had less instructional time than assumed before the fall test and more between fall and spring. Their fall achievement percentiles may look artificially low, as they’re being compared to students who had more time to learn. But by spring, their growth may appear stronger than it really is, simply because they had four more weeks of learning time than the system accounted for.
On paper, it might look like Adams made impressive gains and Grant fell behind. But these differences in perceived performance may have more to do with mismatched instructional weeks than with any actual differences in teaching or learning.
Moving toward a more accurate interpretation
The goal when considering instructional time before a testing event isn’t to create additional administrative burden, but to ensure your data tells an accurate story. Having schools set instructional weeks that reflect their actual testing patterns rather than using district-wide defaults can improve the accuracy of your percentile rankings and growth calculations.
When instructional weeks align more closely with reality, you get clearer pictures of student achievement and growth. You can trust that a student’s 60th percentile growth ranking reflects genuine progress, not a timing artifact.
Making the most of precision
Accounting for instructional time with precision is one of the enduring strengths of MAP Growth, as I discussed in “Same scale, new reference: What’s new in the 2025 MAP Growth norms?” It’s baked into the 2025 norms and supported by our rigorous methodology. But like any powerful tool, it works best when it’s used correctly.
If you’re using MAP Growth to monitor student progress, evaluate programs, or inform high-stakes decisions, now is the time to ensure your instructional week settings are dialed in. A small adjustment can make a big difference in what your data is really telling you. Let your data reflect what matters most: your students’ learning, not just your calendar.
To learn more, read our articles “Same scale, new reference: What’s new in the 2025 MAP Growth norms,” “What can you do with the 2025 MAP Growth norms? Turning test results into action,” and “Realistic vs. meaningful growth: Rethinking growth goals with 2025 MAP Growth norms.” I also encourage you to watch our on-demand webinar and our video titled “MAP Growth norms: How NWEA measures growth and achievement.”