 The 2025 MAP® Growth™ norms are here, and while your students’ RIT scores are still measuring achievement on the same scale you know and trust, the reference point for interpreting those scores has shifted to reflect how students are actually performing today. Think of it like Google Street View updating its imagery. You’re still navigating the same streets, but now you’re seeing what the neighborhood actually looks like today, instead of photos from five years ago.
Why NWEA updates norms
Norms are essentially a snapshot of the national academic landscape. They tell us what “typical” looks like by describing average achievement and growth patterns across students nationwide. But here’s the thing about snapshots: they need refreshing to stay accurate.
Just as student populations, teaching practices, and educational contexts evolve over time, so does student performance. The norms we use to interpret MAP Growth scores need to reflect these changes to remain a meaningful and useful point of context for understanding student performance. That’s why NWEA updates norms every few years, ensuring that when you see a percentile rank, it truly represents where a student stands compared to their current peers, not students from several years ago.
This year’s update is particularly significant because it coincides with the full transition of updating the MAP Growth test to reflect the enhanced item-selection algorithm, or EISA. EISA improves how MAP Growth selects items for students so that it prioritizes grade-level items when they match a student’s ability level. The result is that we’re seeing more instructionally relevant test experiences. Updating the norms ensures they are calibrated to the behavior of the test as it functions today, so the reference points accurately reflect how students perform under the improved algorithm.
Key changes in the 2025 norms
The story of what’s changed in the 2025 MAP Growth norms isn’t one you can tell in a single sentence. The shifts vary depending on where a student falls within the achievement distribution, which grade they’re in, and which subject you’re looking at. While these norms are more accurate reflections of current student performance, they also reveal that not all students and subjects are following the same trajectory.
In general, the 2025 norms reflect a downward shift in student achievement compared to 2020, along with increased variability. This means the differences are more pronounced at the lower end of the achievement spectrum, consistent with findings from NWEA COVID-19 research.
The new norms also capture the impact of changes to MAP Growth’s algorithm, including the introduction of EISA, which has resulted in higher typical growth in math.
The bottom line for score interpretation
Here’s the key takeaway: as a general rule, the same RIT score will now correspond to a higher percentile rank than it did under the 2020 norms. While patterns vary by subject, grade level, and achievement level, this is the directional shift to expect across most (but not all) scenarios.
Variation by subject and performance level
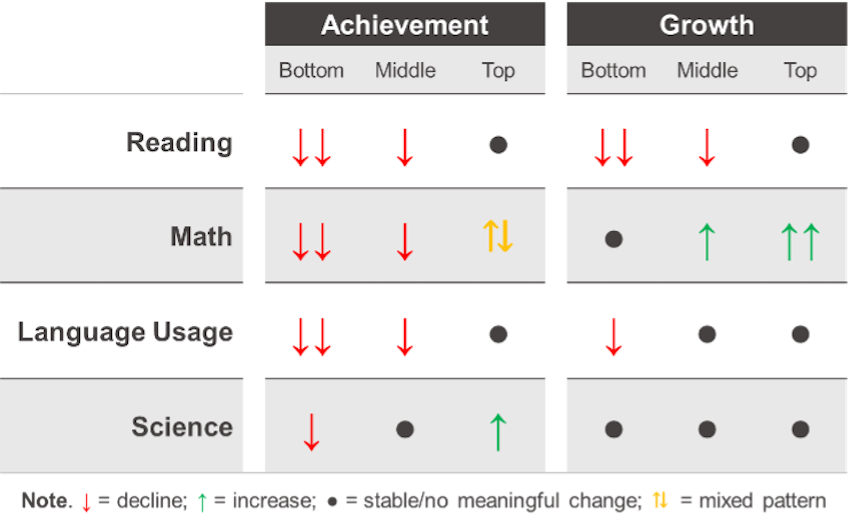
The summary table below highlights how changes in achievement and growth vary by subject and student performance level. As you can see, it’s not simply “up” or “down” across the board. You’ll notice the most pronounced declines (meaning lower RIT scores are now associated with the same percentiles) tend to occur among lower-achieving students, especially in reading and language usage, while math shows a more complex pattern, particularly for higher achievers and in growth. Science proves to be the most stable of the subjects, with less notable shifts across the board.
 What this means for you
So what do these shifts mean for your day-to-day work with student data? The most immediate change you’ll notice is in how RIT scores translate to percentiles.
Because achievement has generally shifted downward, a student’s RIT score will typically correspond to a higher percentile than it did under the 2020 norms. For example, a fifth-grade reading score that previously placed a student at the 50th percentile will now place them at the 56th percentile, even though their actual achievement hasn’t changed.
Conversely, if you’re looking for students at a specific percentile—say, the 30th percentile for targeted support—the RIT score that corresponds to that percentile will likely be lower than you’re used to seeing.
Time to revisit program decisions
These shifts create an important opportunity to revisit the percentile thresholds you use for program placement and intervention decisions. We’re not suggesting you abandon percentiles or automatically change your cutoff points but, rather, that you take this moment to ensure your thresholds still reflect your priorities under the new norms.
It may become “easier” for students to qualify for advanced learning opportunities, since the same RIT scores now correspond to higher percentiles. A student who previously fell just short of your gifted program’s 95th percentile cutoff might now qualify with the same level of achievement.
On the flip side, it may become “harder” for students to qualify for intensive intervention programs if your criteria are based on percentile ranks. Students who would have qualified under the previous norms might now fall just above your intervention thresholds.
The key questions to ask yourself: Why were those thresholds originally chosen? Do they still align with your goals, resources, and student needs under the new norms? Normative cuts can still be useful and appropriate, but they should be intentional choices that reflect your current priorities, not simply inherited from previous years. For more on using MAP Growth data to make program decisions, I encourage you to read my colleague Scott Peters’s article “Every school has advanced learners. Use local norms to find them.”
What stayed the same: The enduring strengths of MAP Growth norms
With all this talk of shifts and changes, let’s ground ourselves in what hasn’t changed: the core strengths that make MAP Growth norms so valuable in the first place.
First, the sample: Our norms are built on data from nearly 14 million students, 30,000 schools, 7,000 districts, and all 50 states, making them among the most robust and representative in K–12 education. That breadth ensures that the comparisons you’re making are truly national in scope.
Second, our methodology: We use rigorous, peer-reviewed approaches to modeling growth and achievement, and we continually refine those methods to reflect best practices in educational measurement.
Third, we account for time more precisely than other assessments, not just by season but by calculating weeks of instruction. For example, a “fall” testing window could mean testing at week 2 of school or week 8, and that’s a huge difference in learning opportunities. Our norms account for specific weeks of instruction, so a student’s performance is contextualized more precisely against peers with the same amount of instruction, not just a blunt seasonal label.
And, finally, we include both school and student norms, which means you can understand how individual students compare to national patterns through student norms and how your school’s aggregate performance compares nationally through school norms.
These enduring strengths are part of what makes MAP Growth so valuable, and they remain in place in the 2025 norms. While the reference points have updated to reflect today’s students, the foundation of rigorous, comprehensive, and precise norming that you rely on continues unchanged.
The 2025 MAP Growth norms give you the same trusted tool, just calibrated to the reality of where students are today. And that’s exactly what good norms should do.
To learn more, read “What can you do with the 2025 MAP Growth norms? Turning test results into action” and watch our on-demand webinar and our video titled “MAP Growth norms: How NWEA measures growth and achievement.”