 In the push to support teachers and students, it can be easy to overlook a crucial group: administrators. Yet when administrators are truly engaged in data conversations, everything changes.
At the NWEA 2025 Fusion conference, leaders from San Bernardino City Unified School District in California shared their journey—one that began with fragmented assessment practices and evolved into a cohesive, district-wide approach powered by MAP® Growth™. Their story is a testament to the transformative impact of administrator buy-in and how strategic leadership can drive meaningful change.
San Bernardino’s journey toward unification
San Bernardino City Unified School District is one of California’s largest, serving nearly 46,000 students across 74 schools. Like many large districts, they faced familiar challenges: a patchwork of assessments, a lack of common language around student data, and frequent administrator turnover.
San Bernardino’s journey toward a more cohesive approach began with teacher-created, standards-aligned assessments in 2017. Over the years, the district revised assessments based on teacher feedback. The turning point came in the 2021–2022 school year, when San Bernardino adopted MAP Growth as its first K–12 assessment. The change allowed educators across the district to use the same language about assessment for all grades.
Building buy-in
A unified assessment system is only as strong as the commitment from district leaders. In San Bernardino, building that buy-in meant creating intentional spaces for administrators to explore data, collaborate, and grow together. District leadership instituted an instructional supervision framework as well as monthly administrative institute meetings and data walks.
The instructional supervision framework
The framework instituted by the district brings together several key elements:
- Site landscapes. Administrators conduct classroom walk-throughs in the fall, gaining a contextual analysis of instructional practices and classroom environment. They conduct another walk-through in the spring to see the impact any support is having on teachers.
- District learning walks. Schools are grouped into clusters, allowing leaders to meet, share insights, and observe practices across campuses.
- PLC teams and instructional rounds. Collaborative teams and rounds encourage ongoing dialogue about learning, assessment, and enrichment, modeling the work administrators want to see in their schools.
- Lesson study and individual walk-throughs. Site-level initiatives encourage grassroots innovation and in-person coaching.
- Evaluation observation. Progress toward teaching standards is measured, with evidence-based feedback provided to educators.
It’s important to remember that this isn’t just a checklist. It’s a living structure that helps administrators support both site and district priorities.
The administrative leadership institute meetings and data walks
San Bernardino also introduced monthly full-day sessions for principals. These meetings create space for leaders to review data together, share challenges, and learn from one another. Each month, administrators examine key MAP Growth reports, such as the School Profile and Achievement Status and Growth reports, to track progress and identify areas for support.
A unique feature of these meetings is the inclusion of “unconference” time. In the afternoon, principals choose breakout sessions based on their needs and interests, whether it’s diving deeper into MAP Growth data, exploring restorative practices, or learning about new technology tools. The element of choice and collaboration helps build a culture where administrators feel empowered to ask detailed questions.
San Bernardino also introduced data gallery walks, where administrators move through stations featuring different data sets—academic indicators, school climate information, and linking studies, for example. These walks encourage leaders to take notes, discuss insights with peers, and bring actionable ideas back to their schools. By engaging with data, especially in a collaborative setting, administrators strengthen their ability to lead data-driven conversations throughout the district.
Using MAP Growth reports to drive decisions
In addition to the School Profile report, one of the most powerful tools in San Bernardino’s data-driven journey has been the Achievement Status and Growth report. It’s a favorite among administrators for its ability to illuminate student progress and guide strategic action. The report uses a quadrant chart to illustrate both achievement and growth. By default, the chart centers on the 50th percentile, representing typical student performance.
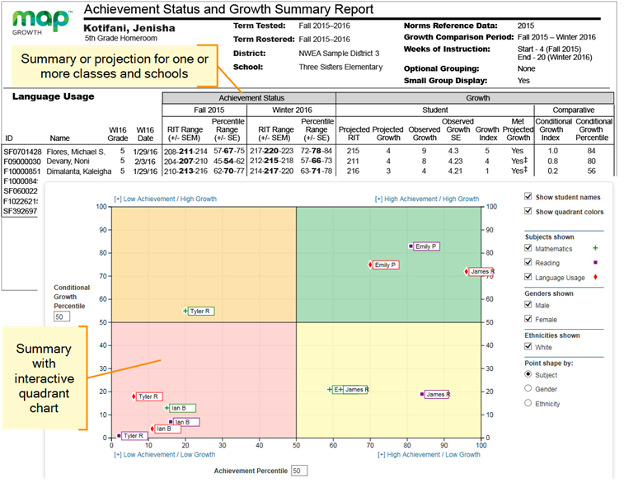
Administrators use this report to group students and identify trends. For example, students with low achievement but high growth (in the upper left of the graph) can help educators identify promising interventions that could be replicated for others. High achievers who aren’t growing (in the bottom right) possibly have untapped potential. The report also helps pinpoint students on the cusp—those on the edge of meeting key benchmarks. Focusing on these students can be especially impactful.
Note that the report isn’t static. Administrators can adjust the achievement percentile to match state proficiency goals, such as moving the benchmark to the 61st percentile for San Bernadino. This flexibility allows leaders to set meaningful targets and track progress toward district priorities.
A particularly useful feature is the integration of linking studies. These studies connect MAP Growth percentiles to state proficiency standards, college readiness benchmarks, and other important outcomes. By referencing linking studies, administrators can ensure their goals are aligned with broader district and state expectations, making the data even more actionable.
Goal setting that goes beyond “typical”
Much of the work that San Bernardino did around engaging teachers and students with MAP Growth results focused on student goal setting. This often meant aiming higher than typical growth, especially for students who needed support closing achievement gaps.
Imagine a third-grader whose fall reading score placed her at the 35th percentile. If she made typical growth (50th percentile), she’d remain at the 35th percentile by year’s end. But by setting a more ambitious yet achievable goal—77th percentile growth—her trajectory could change dramatically. This approach, supported by the MAP Growth Goal Explorer, helps educators visualize what it takes for students to move from below average to proficiency and to set goals that are both aspirational and achievable.
San Bernardino encourages teachers to use tools like the Goal Explorer to set custom growth targets, grounded in each student’s starting point and linked to state proficiency benchmarks. For students starting further behind, multi-year journeys may be needed, but the data makes the path clear. For more on how new MAP Growth norms are shaping goal setting, read “Realistic vs. meaningful growth: Rethinking growth goals with the 2025 MAP Growth norms.”
Student ownership: Making goals personal
Goal setting is a process, a discussion that starts early, whether it’s about math, growth, or learning in general. San Bernadino teachers are encouraged to be role models in the process, sharing how they’ve set goals in their own lives, like training for a marathon. This helps students see that goal setting is simply what people do when they want to achieve something.
- Start by asking, “Where are you going?” A teacher should have a conversation with each student about their learning journey. Instead of centering on the MAP Growth RIT score, teachers can dig into areas of strength and opportunity. What did they find challenging on MAP Growth? What concepts do they feel confident about, and where are they still learning? The Student Profile report can provide data that confirms what a student is feeling, and it can illuminate areas of strength and opportunity that weren’t apparent before. This builds student autonomy and ownership.
- Next, teachers can ask, “How will you get there?” This step helps educators identify specific skills or concepts to work on, like operations with fractions. A teacher and student should build a plan together: What steps will help them grow? Maybe it’s practicing with an online program they enjoy or connecting the content to real-life interests. Teachers should also set clear actions and time commitments as well as talk about mindset. How will they handle frustration or setbacks? What motivates them to regroup and keep going?
- End by asking, “How will you track progress?” Agree on ways teachers should monitor growth, including formative assessment, student self-assessment, and teacher check-ins. Support teachers in deciding on a cadence that feels comfortable for each student and adjusting their plans as needed.
Final thought: Speaking the same language
San Bernardino’s experience with MAP Growth revealed something unexpected about data: it didn’t just drive student achievement; it brought the district together. Departments that weren’t communicating effectively before began collaborating around a shared language and common goals. How can it help in your district?
To learn more about MAP Growth, visit our website or contact our sales team.